
Whoa Nelly

That Energy started off the year strong shouldn’t come as a surprise. That it came in this hot has taken your author by surprise.
To be sure, the macro has been violent year to date. For confounding reasons, the market decided just in the last few days that, indeed, the Fed might in fact taper purchases quicker and kick off a rate hike cycle as soon as March. Just like they’ve been saying.

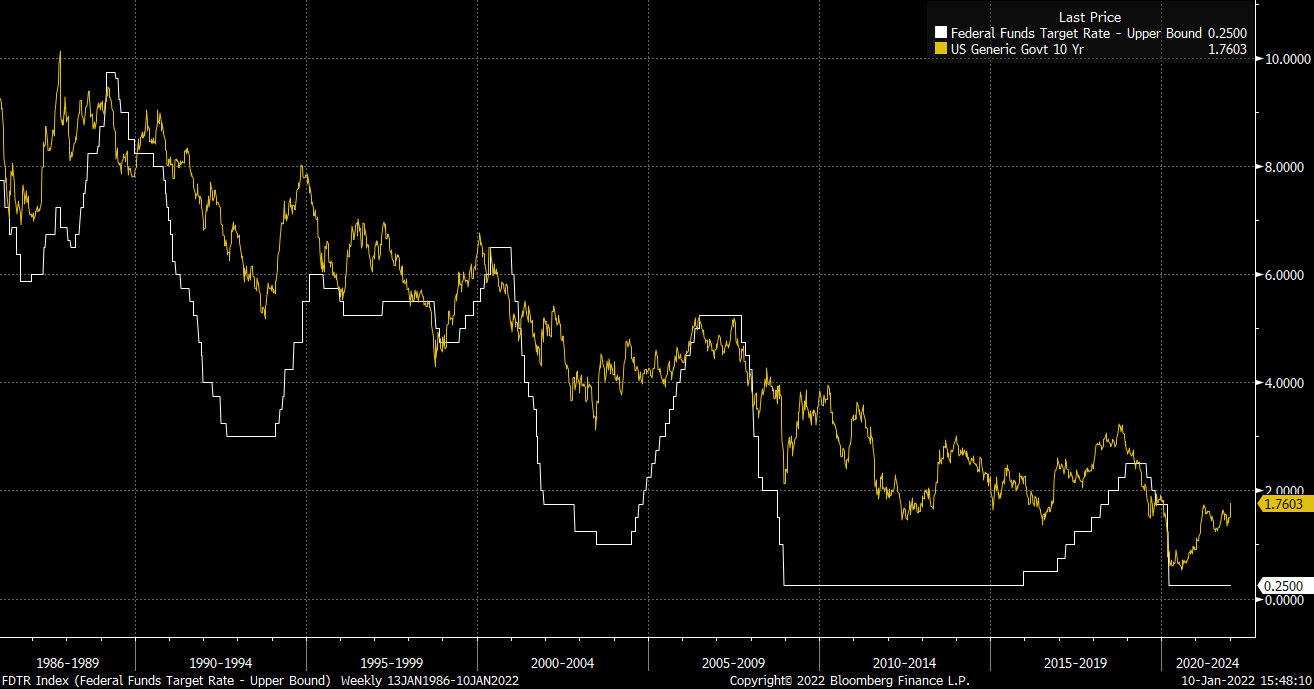
Which we suppose came as a surprise? Because every rate cycle in the last two generations found 10Y yields picking up a few months ahead of the actual hikes.
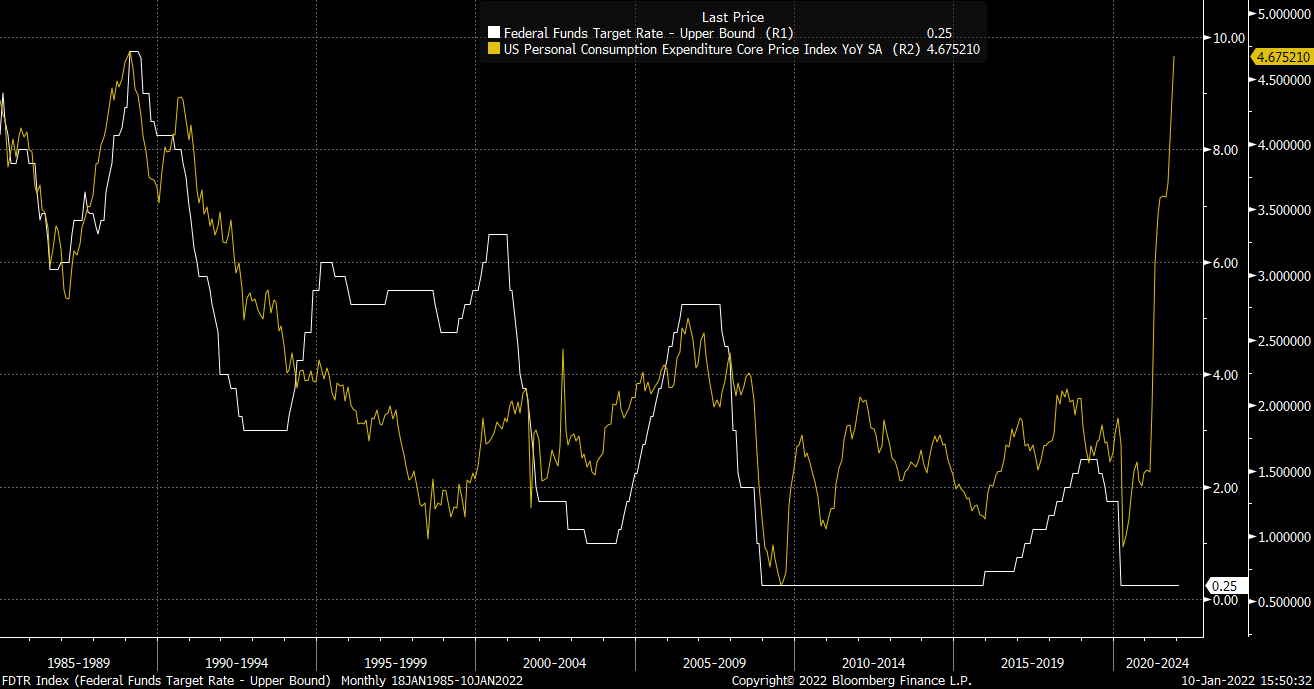
Anyways, the percentage of market participants who were in the market the last time inflation was actually high AND rates were increasing is vanishingly small.
So they pull out the playbook for inflation-induced rate hikes. And they decide that the same playbook applies. They buy Value.
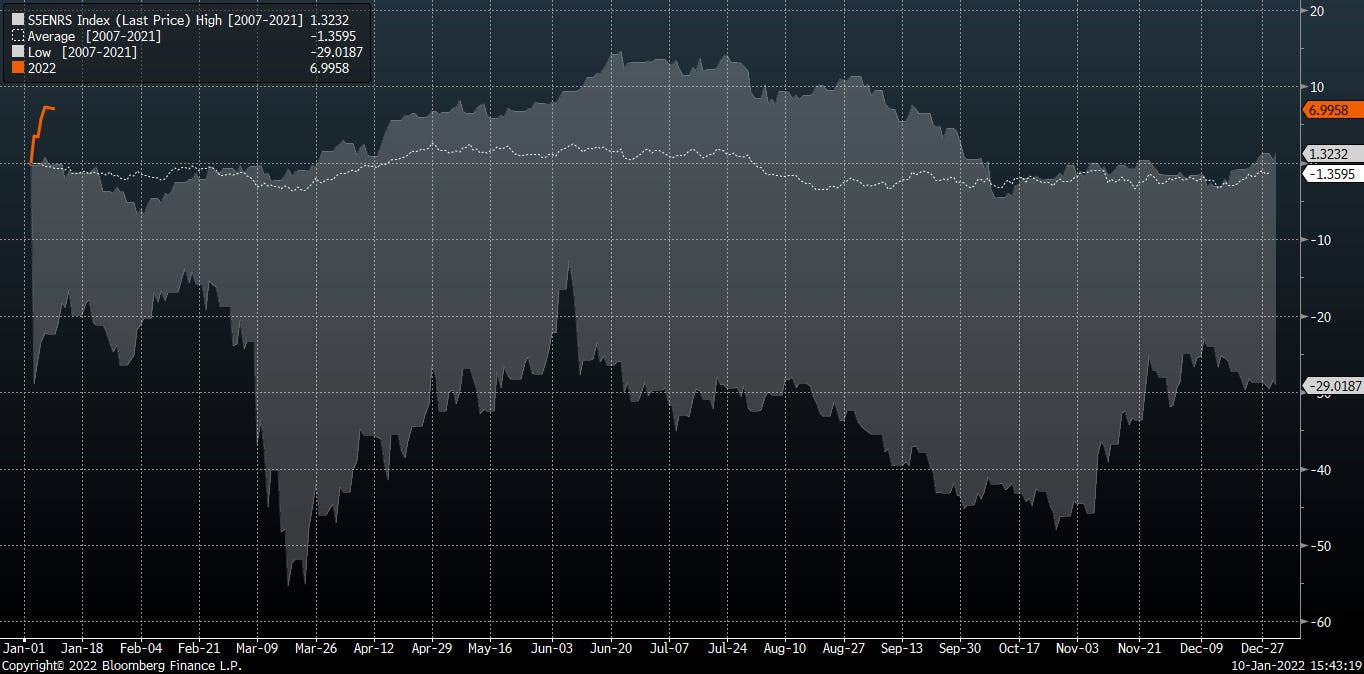
Which is how we get to the place where the Value factor has moved up >600 bps move in the last 50 trading days.

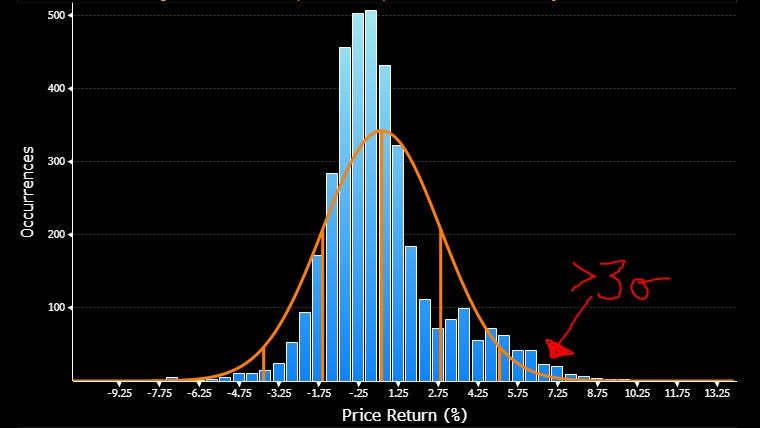
Moves of this size and speed are rather uncommon. Below is a 20yr lookback of 50d performance for Value factor. At over 6%, today it sits at the 3 sigma right end.
As far as what happens after a move like this in Value - below is normalized performance following similar Value moves.
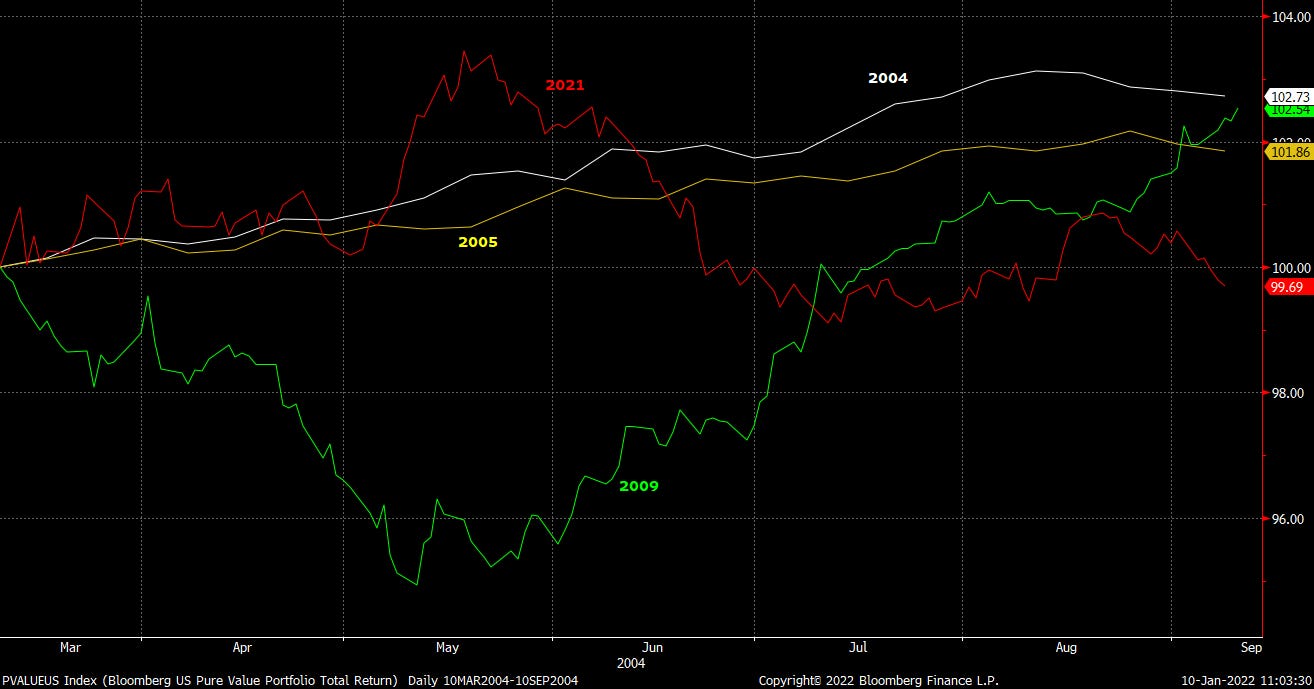
Interesting breakdown on prior runs of Value skyrocketing: twice in the legitimate energy shortage/EM hypergrowth years pre-GFC, and twice off market crashes.
Today, we are neither.
We expect Energy to work in 1H22. But it’s time for a breather.
We don’t expect multiple expansion from here at this point in the cycle.

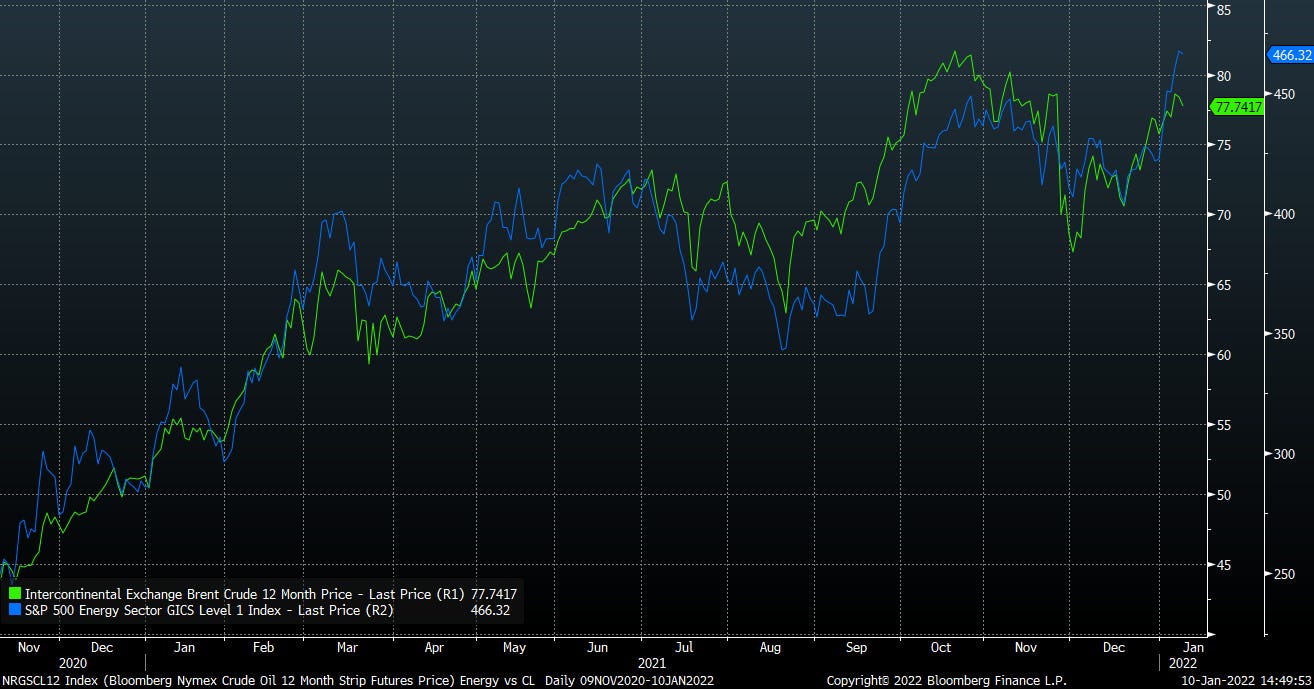
So, the heavy lifting is dependent on sector earnings, which are themselves largely dependent on commodity prices. There may be upside, sure, but the sector seems to be anticipating this already. Below is sector EPS plotted vs a commodity 75/25 crude/nat gas strip.

Energy is extended technically. Anecdotal surveys find investors are most bullish since 2016. Unprofitable, long duration tech is oversold. Short duration assets are overbought. Commodities boom was on the cover of Barron’s . Positioning is offsides.
Tread lightly.
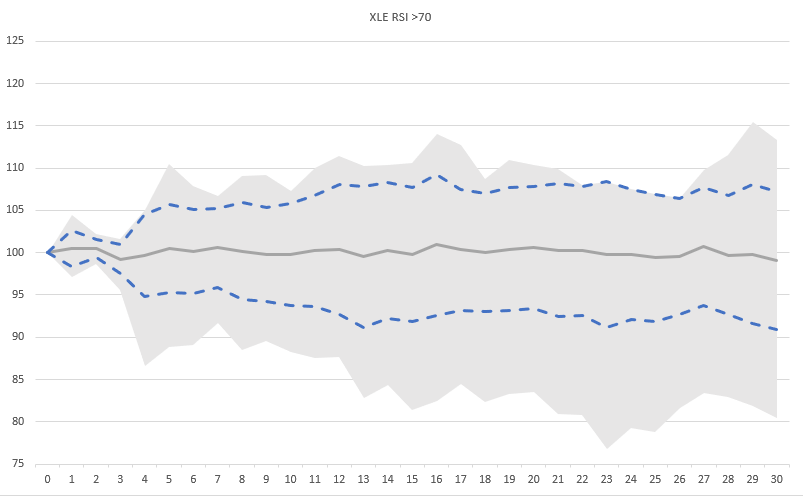
Normalized 5yr performance after XLE breaks above 70 RSI. Median (gray line) flat/down slightly. +/- 1 std deviation performance (blue dash) skewed to downside.
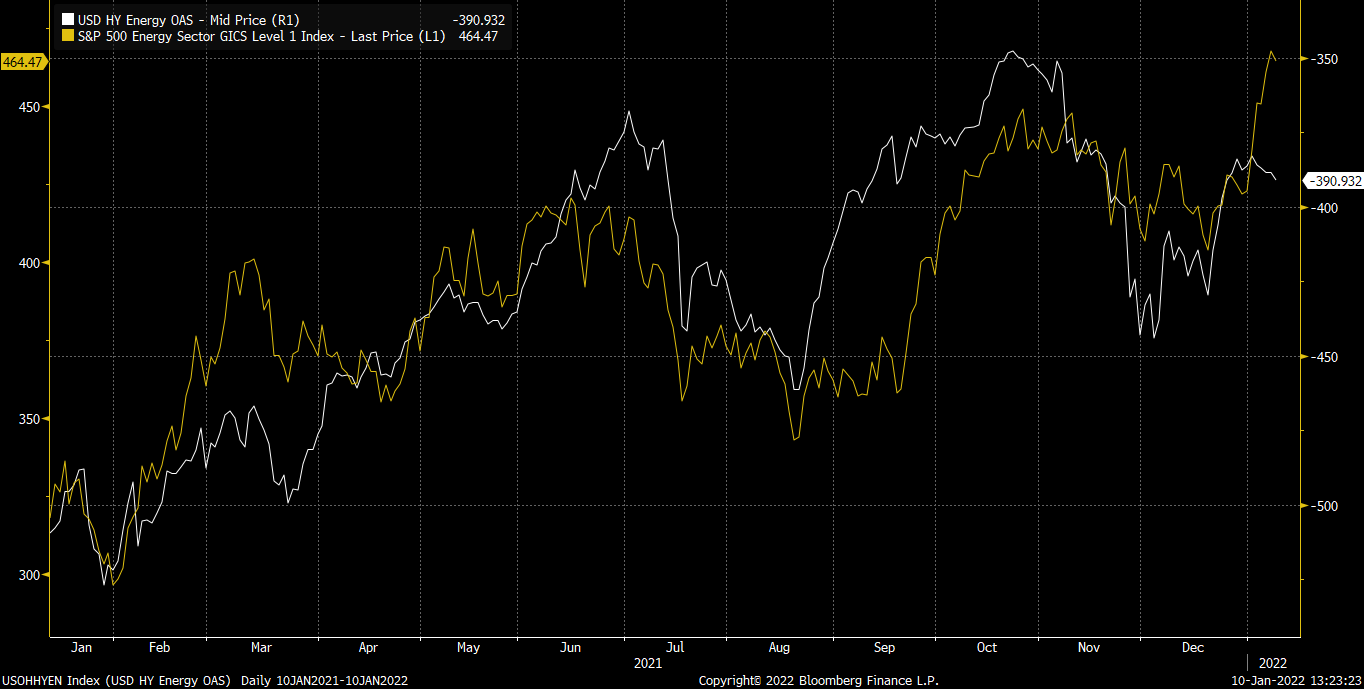
Interesting, Energy high yield Options Adjusted Spread (OAS, white) not following the latest explosion up in the equities (yellow).
Sector running ahead of the commodity.
Let it exhale, pick your spots. The narrative holds, but it’s been a bit much.
VR
viscosityredux@gmail.com