
Time is on your side

This week’s outperformance of Value over Growth is one for the books.
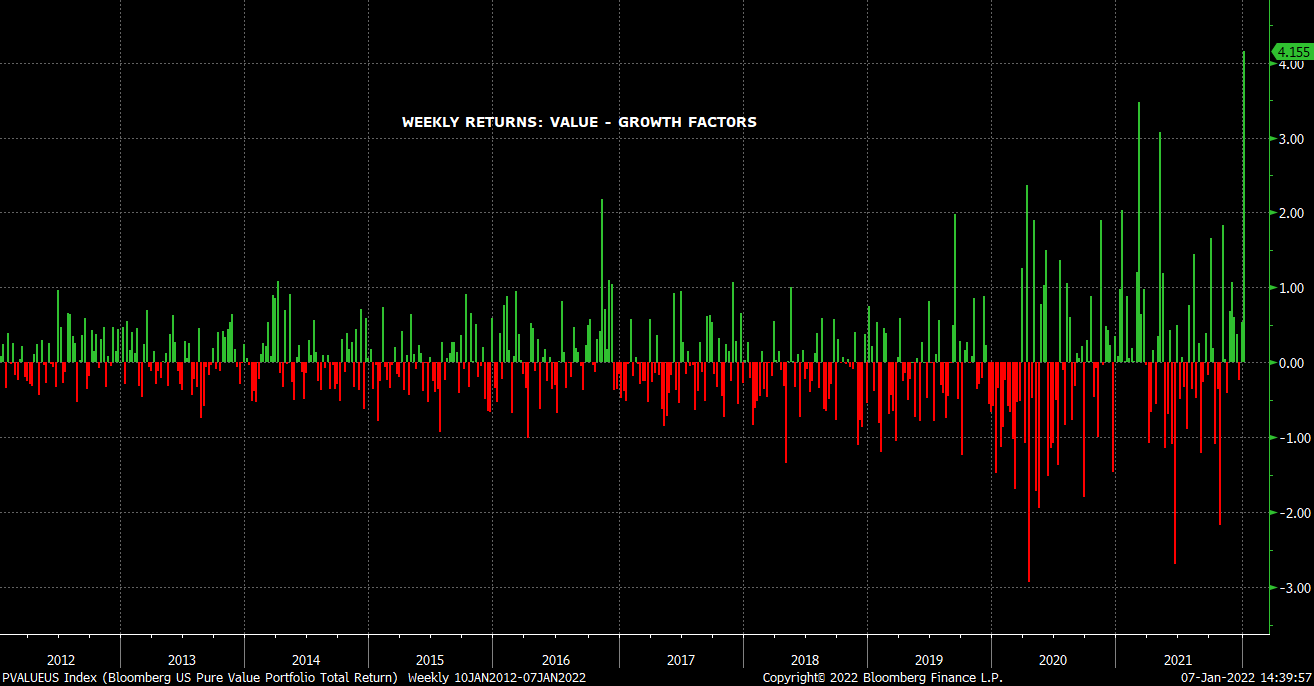
Consigned to the Value bucket, our attention turns of course to implications on the Energy sector. What happened to Energy in the wake of prior Value-Growth outperformance at even half the level of this week?
Normalized performance for Energy sector after Value outperforms Growth by 200 bps.
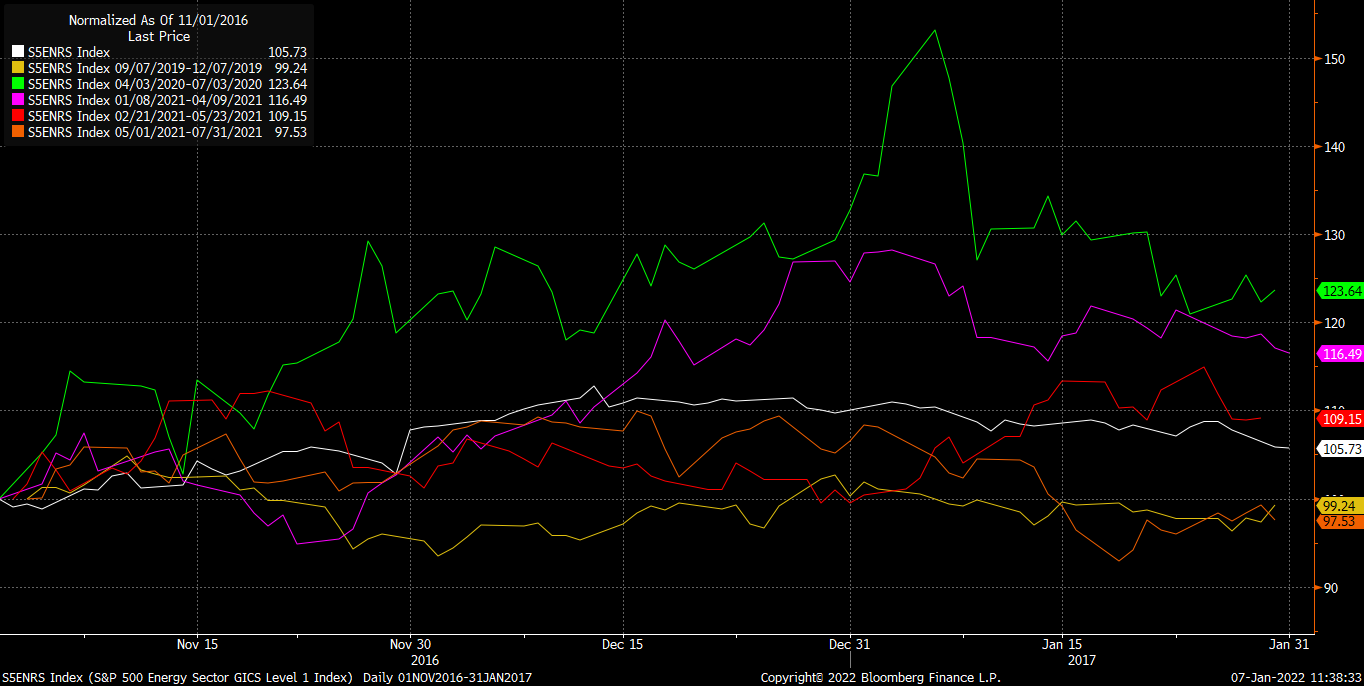
Conclusion? Precedent shows continued strength for two weeks without exception. Median historical occurrences show consistent appreciation for some two months. Decent risk-reward.
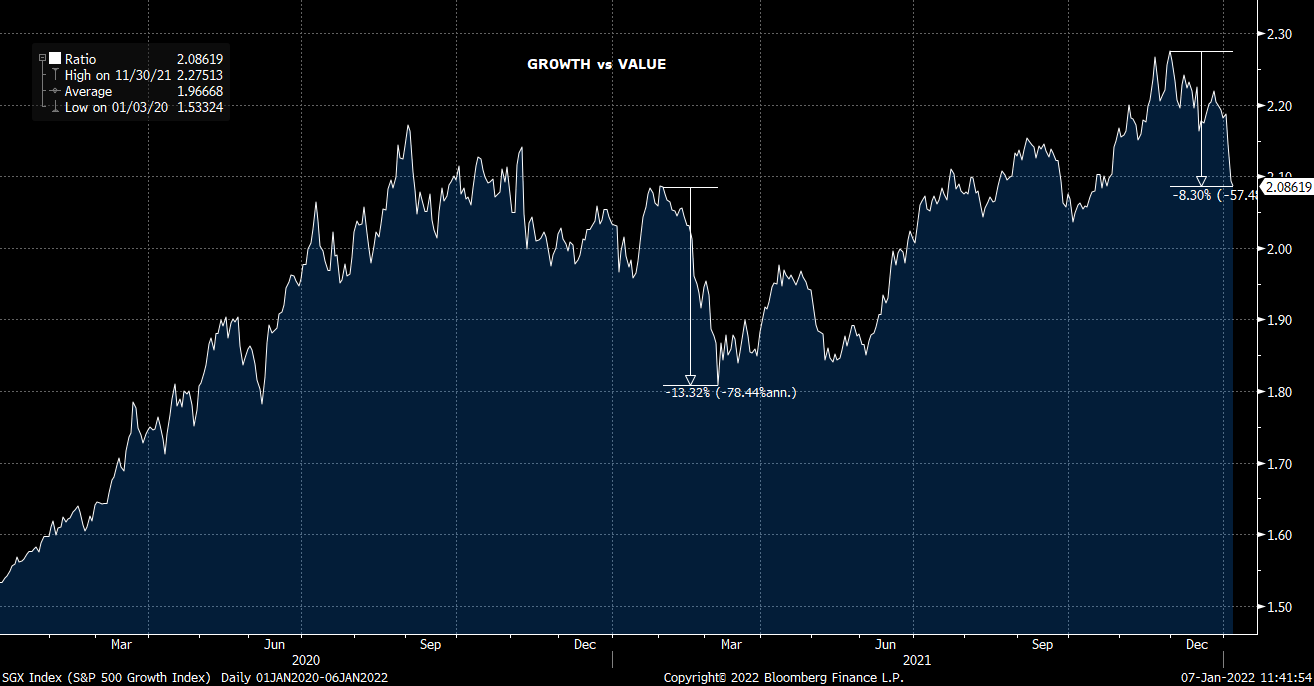
Brokers affirm a massive capital reallocation is underway, and not complete yet. Anecdotally, it is reminiscent of the late 2Q21 reversal. The market today, starting from a higher starting point is only 2/3 through the unwind in percentage terms, with arguably more to go.
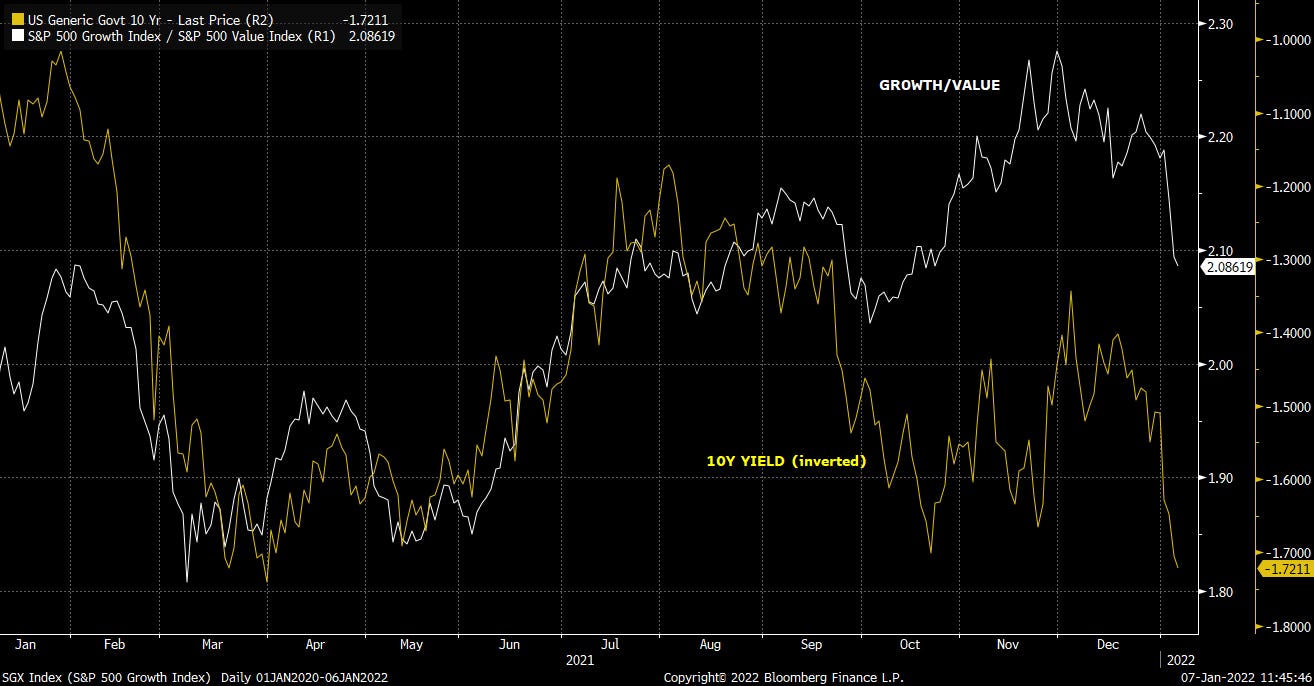
The 1.7-1.8% range in 10Y yield has been a resistance level in recent history and bears watching. But the Growth/Value relationship seemingly ignored the rise in yields in 3Q-4Q21 and may have even more to go if the 2021 relationship is to reconnect.
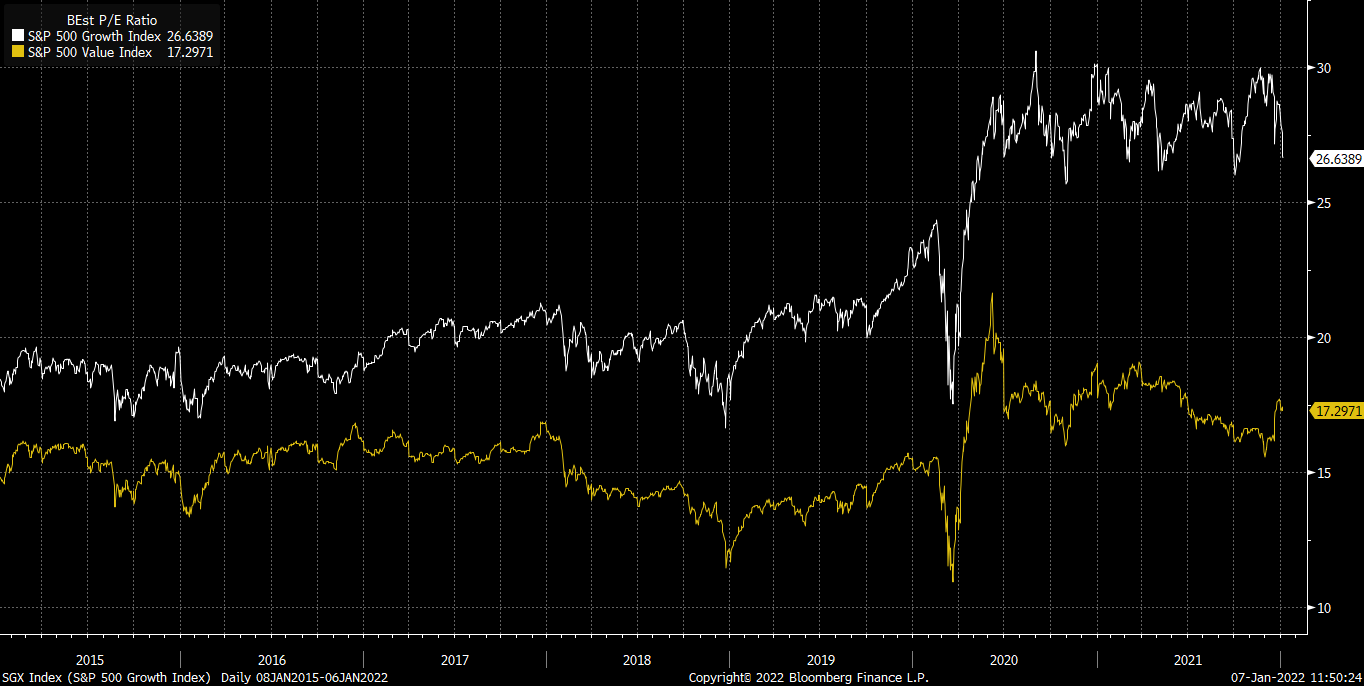
Fundamentally, the trend in EPS growth clearly favored Growth since COVID.

But oh boy did that get capitalized in the relative multiples.
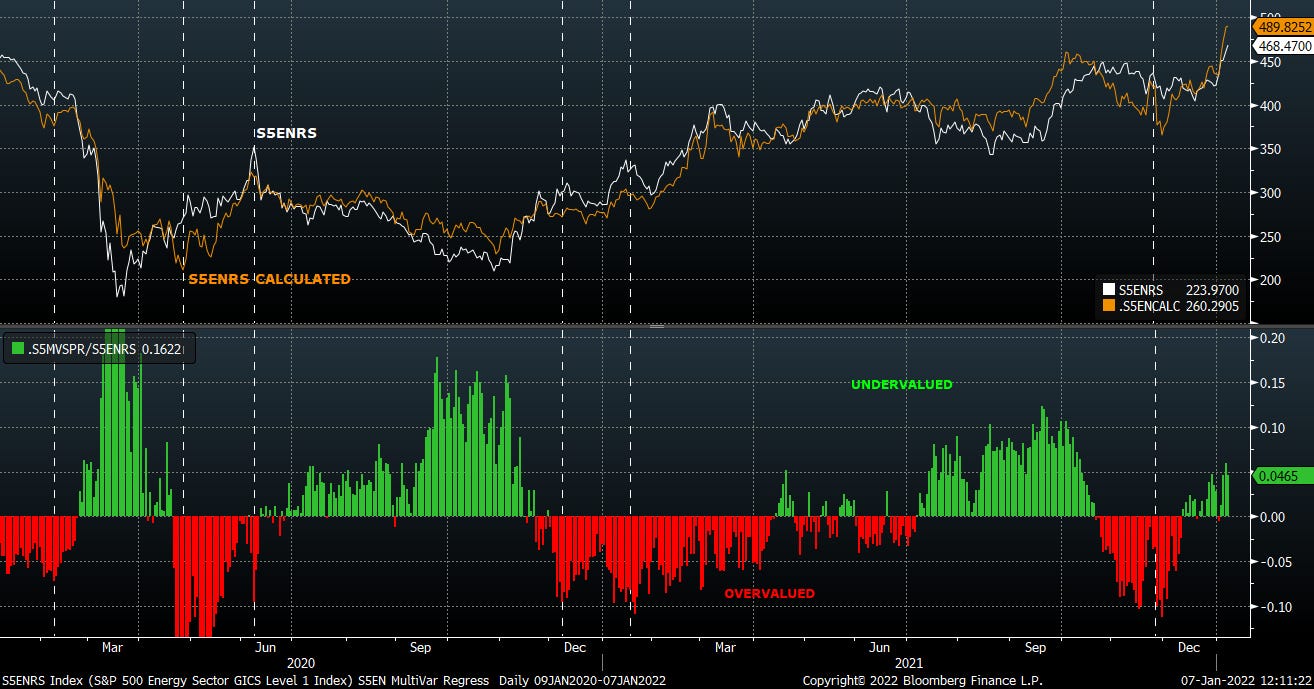
Energy equity valuation is a function of much more than commodity prices. We use a multivariable regression format to scan for periods of the sector being under- or overvalued.
We have the sector undervalued, vis a vis macro factors, by about 5% today.
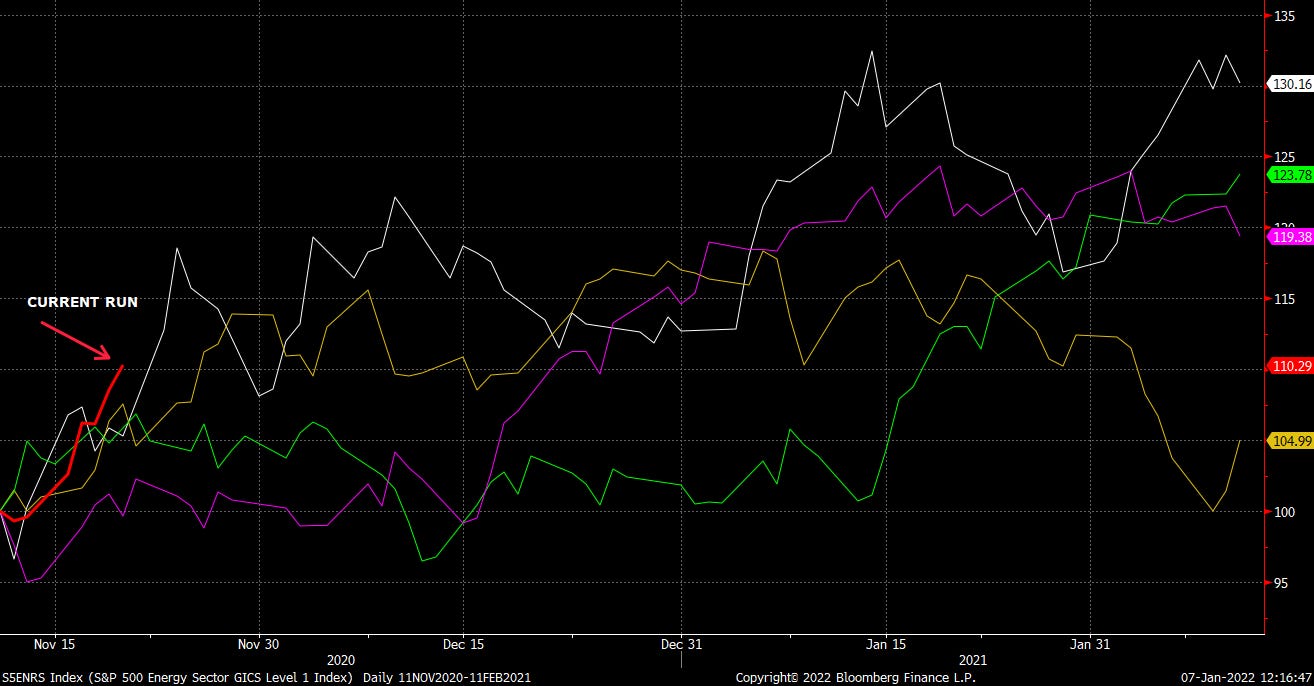
Below is normalized performance of the sector after tripping the 5% undervalued level since the COVID vax announcement in Nov ‘20. n=4
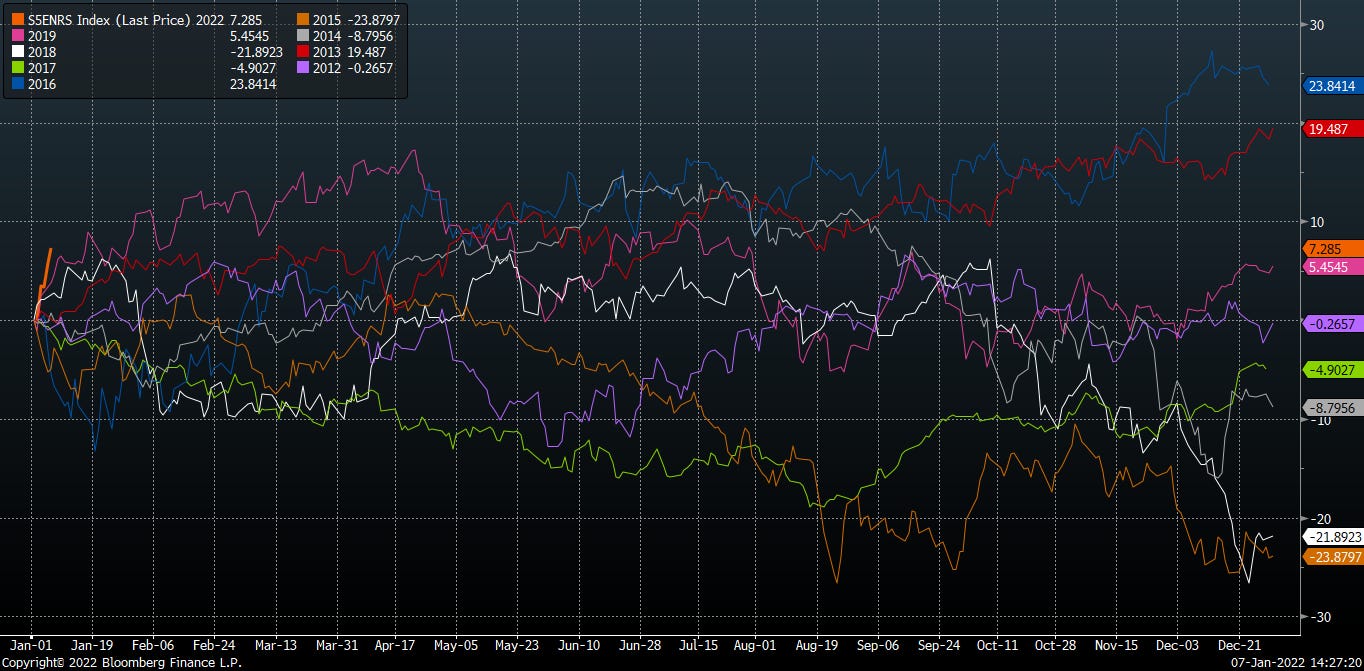
A few observations on seasonality. Apart from 2021, which was on the heels of the COVID vaccine announcement, this is the best start for the energy sector this century.

With the 2021 mega rally and 2020 mega collapse the outliers (and thus omitted), here’s a chart of normalized seasonal performance over the last 10 years. 2021 doing quite well out the gate.
The start of ‘19 was an interesting period. Energy had been pounded in 4Q18 as the Fed hiked one or two too many times and forced the Fed into the Powell pivot near year end. Risk assets rallied. Energy followed suit into 2Q of that year. Then gravity caught up with the sector.
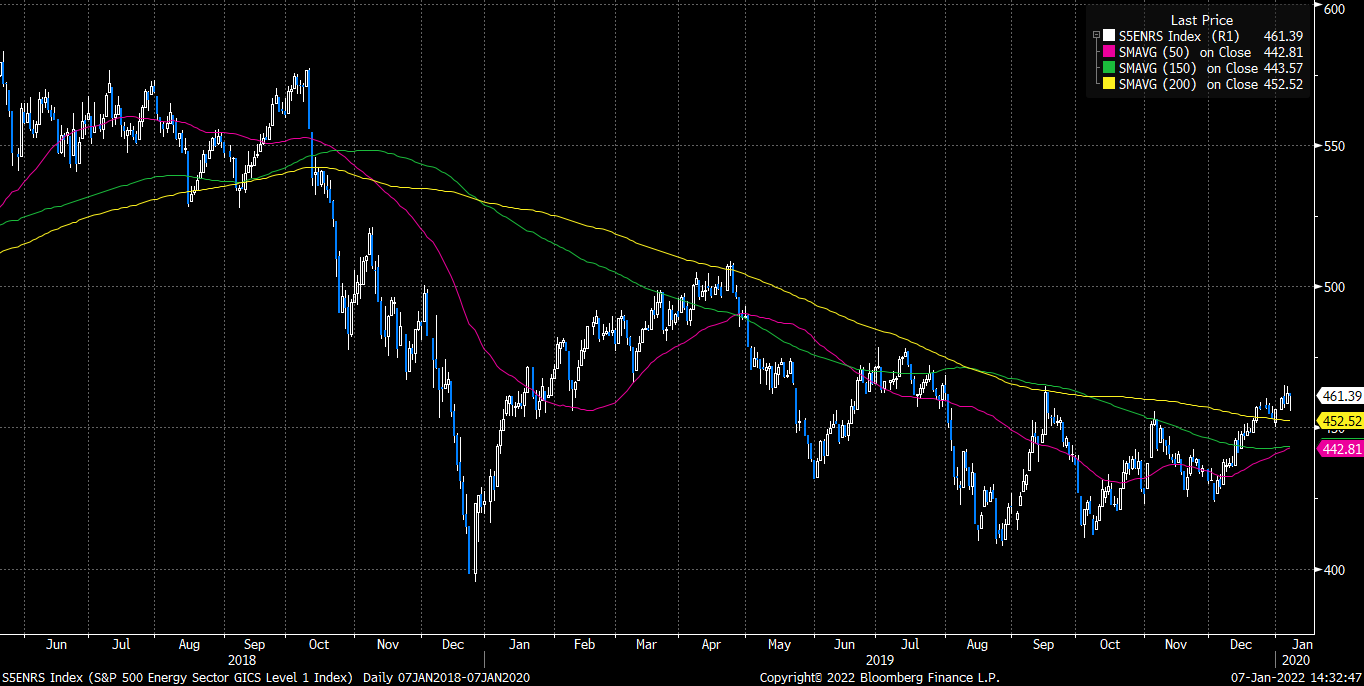
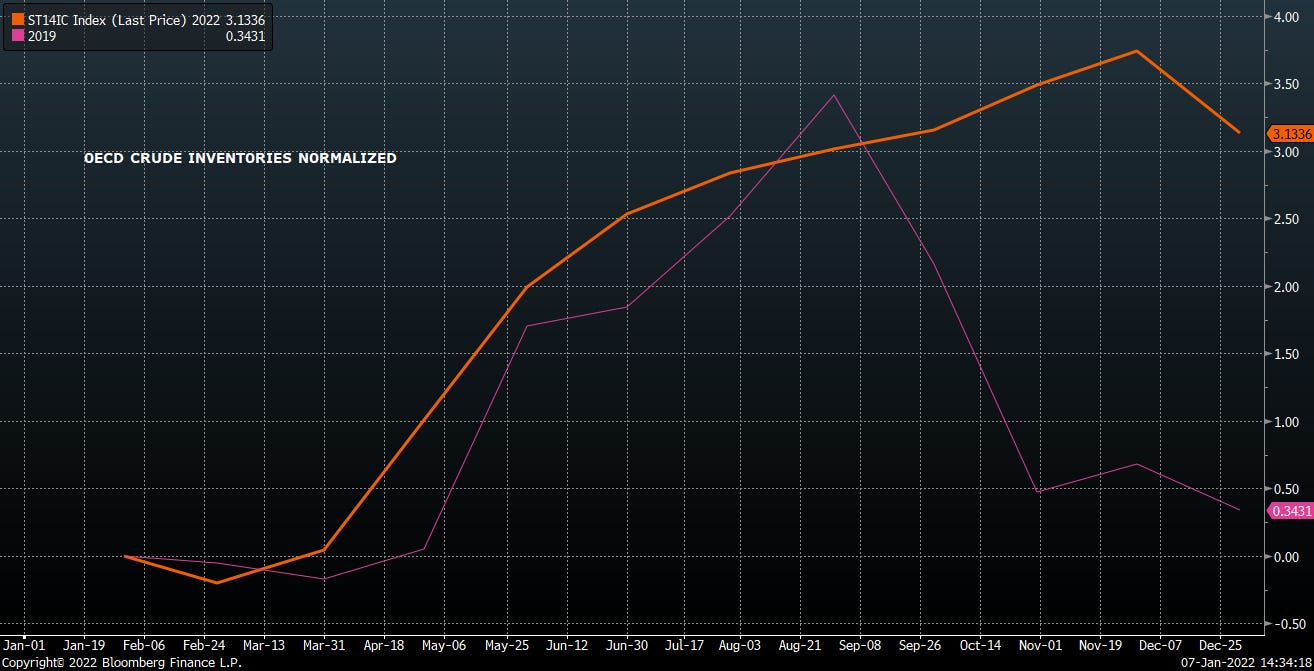
What was interesting was the relatively accommodative situation on global crude inventories in 2019. Inventories were down small and started to build by 2Q - just like expectations for 2022. Something to keep in the back of your mind as we progress through 1Q22.
Another reminder that stocks follow earnings. Below is a chart of YTD earnings revisions and YTD price performance. The outliers include NEX, who issued a mega positive revision this week - dragging up peer LBRT in sympathy (no earnings updates yet). PBF clearly calling around and guiding up estimates, resulting in the stock moving 17% Thurs-Fri.
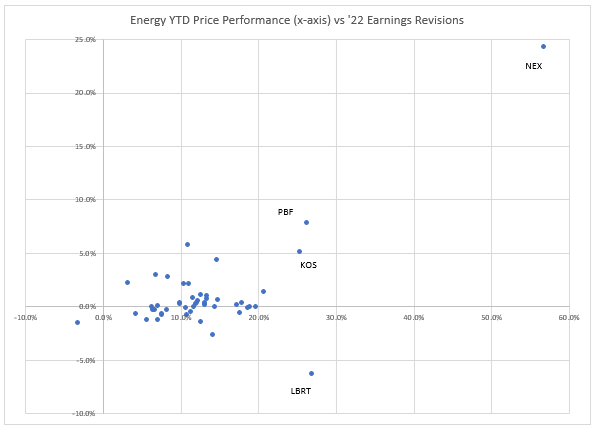
Biggest risk of negative revisions in the coming weeks in our mind? Nat gas equities and refiners.
Positioning
Pairs trades in the cyclicals space (long - short):
HES-OXY
EOG-COP*
LNG-EPD
CTRA-EQT
DAR-MPC
VLO-PSX
PXD-HFC
MRO-APA
CTRA-EQT
OVV-RRC
CLR-AR
GPRE-REGI
DBA-XOP
- DVN short
- AMTX short
*new 1/7/22
-VR
viscosityredux@gmail.com