“What to do if you find yourself stuck with no hope of rescue: Consider yourself lucky that life has been good to you so far.”
The Hitchhiker’s Guide to the Galaxy (1979), Douglas Adams
There is no rescue coming to the crude market this year from North American oil.
An energy treatise of three related topics:
I. Barrels: Globe is still short crude & call is to NAM producers for more barrels
II. Boards: Getting better, instilling discipline in managements. No big production ramp in ‘22
III. Bottlenecks: Supply chain issues impeding hypothetical NAM crude ramp
The crude market was tight before the Russian invasion of Ukraine, an action which further tightened the market to a degree that has not yet been understood. Russian energy sales are slowly falling off the market as old buyers self-sanction and new buyers cannot buy enough incremental to avoid a material net loss of hydrocarbon supply. The most recent SPR announcement will help blunt, but not alleviate the pressure on the crude market, and introduces even more risks in the medium term. With OPEC+ only gradually ramping and only two members with reliable spare capacity of size, the market is calling on North America to supply incremental barrels.
After years of underperformance, value destruction, and outright ridicule, energy managements and boards have modified their behavior, for now. Management teams are not incentivized to grow this year and have severely curtailed capital in this commodity rebound, because that’s what they’re being paid to do - finally.
Energy company executives are being paid NOT to drill today.
Furthermore, as much as E&Ps are unwilling to ramp capital, so too are OFS companies unable to accommodate it.
North American crude oil supply’s trajectory is locked in for 2022.
We like the ’23 crude curve, refiners (love, not like), select oil producers, and increasingly oilfield service providers.
I. Barrels
Tape bombs are now a feature every day in the crude oil market – but in the end, the market stays tight until demand collapses. Recent events have affirmed our expectations of a net 1-2 mmbbl/d loss of Russian exports attributable to self-sanctions. This week’s SPR announcement, should it be enacted at the unprecedented levels advertised, helps market balances in 2Q22-3Q22, but makes the crude market even tighter in the medium term. The Shanghai lockdowns ease global demand at the same time as the SPR release hits the market, and the market may hope to be in balance as these two stars align. OPEC continues to stick to its plan and can’t/won’t increase production to ease consumers’ burdens.
Russia
Prior to the Ukraine war, Russia was producing circa 11 mmbbld of crude/condensate. It exported 5 mmbbld crude and another 2 mmbbld of refined products. Europe was the destination for most of its energy exports. That is rapidly, yet opaquely, changing.
Russia crude exports
Although the Western sanctions have explicitly omitted energy from the list of products now off-limits, buyers are eschewing Russian energy en masse in what is referred to as “self-sanctioning.” This is resulting in realignment of Russian energy flows as less goes to Europe and North America, offset in part by more going to Asia via China and India.
Market uncertainty has centered on whether incremental Asian buying could offset less buying from the West. Our contention has been and still is – no. Asia will buy more, but cannot buy enough to completely offset the loss of European/American flows. As the Ukrainian conflict continues, the pressure on Russian energy exports grows and dislocations grow further entrenched. With limited storage to hold excess production, Russian flows production is at risk of outright shut-in.
We are beginning to see the signs of these shut-ins today:
Russian refiners to make run cuts
Widespread signs of decline
Exports slumping
Refiners shutting in as product storage maxed out
We reiterate our expectation that 1-2 mmbbld of Russian crude & refined product exports at high risk of disappearing from global market
See our earlier piece for a more comprehensive overview:
Strategic Petroleum Reserve (SPR)
Is this latest SPR announcement, the third in just four months, to test the veracity of “3rd time’s the charm”?
On 3/31, the Biden administration announced plans for another release of crude from the US SPR – a bold 1 mmbbld release for up to 6 months. Per the announcement “after consultation with allies and partners, the President will announce the largest release of oil reserves in history, putting one million additional barrels on the market per day on average – every day – for the next six months.”
Answering our question on whether the administration would have to replace the SPR reserves sold today at some point in the future, buried in the release further down is the statement “the Department of Energy will use the revenue from the release to restock the Strategic Petroleum Reserve in future years.”
Given the unprecedented scale of the planned release, the market is rightly asking questions about the sustainability of SPR deliveries of this magnitude. The SPR has managed brief withdrawals of 600-800 kbd a handful of times in its history. Never 1 mmbbld. Never near 6 months duration.
SPR weekly flows
The federal government will put a lot of barrels on the market to reduce price during a period of tight global supply/demand balances. This will stimulate product demand and incrementally discourage investment in future supply. Furthermore, they’ve clearly telegraphed plans to buy back the crude (presumably at a lower price in their minds) in the future, adding another source of exogenous demand to a tight market. The release arguably helps the market near term, at the expense of making even the medium term even more challenging.
They’re adding a one-time supply dump, while disincentivizing investment in future supply growth, and artificially supporting demand. It will likely help the markets for a few months, sure. But it doesn’t end well.
US SPR Trajectory post-3/31 announcement
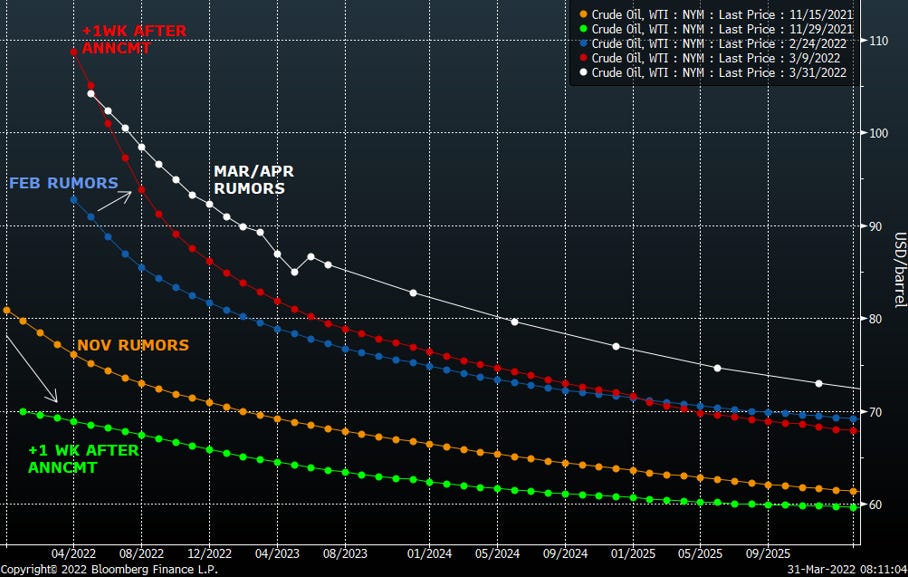
How did the market receive SPR release announcements the last two times? In November 2021, it shaved about $10/bbl off the front months, with a much smaller impact further out the curve. In Feb 2022, the curve actually rose.
11/23/21: 50 mmbbl (32 mmbbl exchange to be returned later + 18 mmbbl accelerate sale of authorized volumes)
3/2/22: Coordinated global SPR release. 30 mmbbl US + 30 mmbbl international. First rumors on 2/24 as Russia invaded
WTI Crude Curve
What happens after 6 months and the SPR is at its lowest level since they finished filling it in the 1980s, China is (hopefully) out of lockdown, and Russia hasn’t left Ukraine?
OPEC
OPEC, in its 12 minute meeting 3/31, again stuck to plans to increase production by 430 kbd in May. It continues to adhere to its strategy of gradually unwinding the COVID-induced production cuts. The group again is unlikely to meet its production quota. No incremental help coming from the consortium.
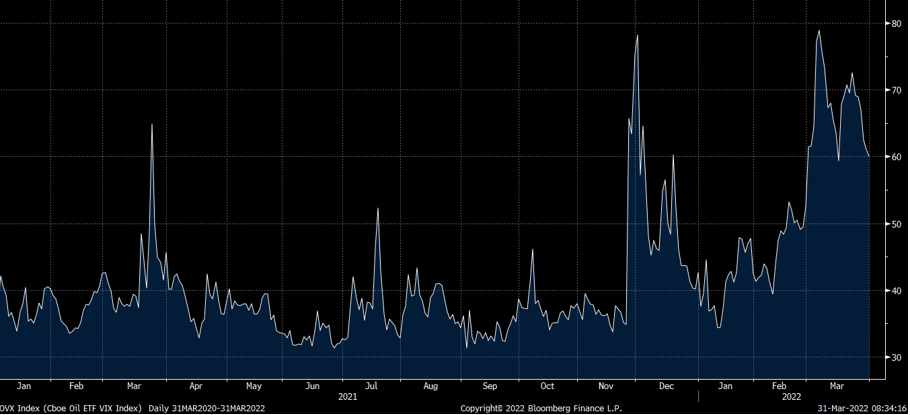
From here, headline risk abounds. Lower liquidity and lighter positioning means high volatility for crude.
Market expectations of 30d volatility of crude oil prices
On fundamentals, we still see a tight market, ultimately beholden to the net loss of Russian supply.
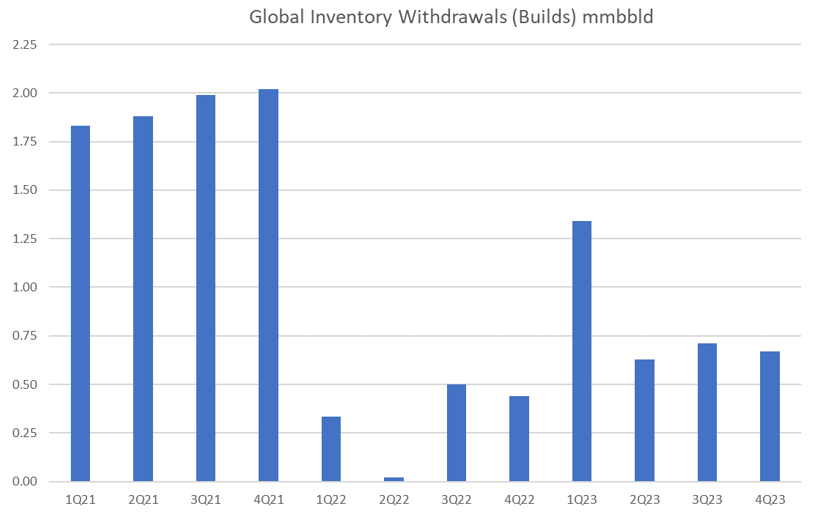
Rolling through an optimistic efficacy of SPR release, a relatively mild hit to Russian crude/product exports, and reduction in China demand during the Shanghai lockdowns, we find a best scenario with the market roughly balanced in 2Q22. 3Q22 onwards it’s tight again and inventories keep drawing.
Prices move in the opposite direction of inventories.
II. Boards
Earlier in our career, we focused on modeling as the be-all/end-all in analyzing a company. Get the earnings and cash flow right, complement that with a few valuation approaches such as NAV, multiples, M&A comps to arrive at a conclusion on what the stock was worth and what it’s likely trajectory would be.
Over time we acquired some gray hair, market-induced scars, and an enduring sense of skepticism. We dismissed hyperbolic highlights in slide decks and press releases. We cared less about press release commentary and more about what management teams did.
We came to appreciate that management teams do what they get paid the most to do. We paid more attention to compensation schemes. We followed proxies and boards.
The board of directors is an elected group of individuals that is supposed to represent the interests of shareholders. According to ExxonMobil’s proxy statement “As part of its oversight role, the Company’s Board of Directors evaluates, with management, the Company’s strategy, capital allocation framework, operating expenses and emissions reduction goals on an ongoing basis. This evaluation takes into account the varied perspectives of the Company’s shareholders, whose views are actively requested and received as a result of the Company’s engagement efforts.”
Great summary. The board’s job is to provide oversight, counsel, and guidance to the company’s senior management while considering the interests of the company and owners.
A good board will be comprised of independent, qualified directors from diverse backgrounds whose breadth of experience and insights will support the company’s goal of building shareholder value, providing governance, and managing the strategic objectives of the firm.
Board Composition
A good board brings legitimate breadth of expertise to bear in the oversight of the company.
PXD board qualifications
In an ideal world, management works for a board that is in turn working on behalf of shareholders. In Energy, we’ve seen several instances where board seems to work more for management.
A look at what we consider to be a “less than ideal” board. We don’t do banking and we’re anonymous, so we take a little detour into Dallas-based Comstock Resources (CRK) circa 2017-2018, before Dallas Cowboys owner Jerry Jones took a controlling stake in the company.
At year-end 2017, Comstock’s board had nine directors, including the CEO and CFO. The 7 outside directors consisted of 6 men with an average age of 72 years, plus one woman aged 55. The outside directors had tenures ranging from 1 year to 22 years.
CRK 2017 Board of Directors
CEO Jay Allison earned three degrees from Baylor University and held deep ties to the institution years after earning his JD in 1981. Famed supporters of Baylor, Allison and his wife had generously donated to multiple capital campaigns and scholarships for the university. We were privy to a few of his Baylor football stories when we’d travel to their offices years ago – playing linebacker in the 1975 Cotton Bowl was a milestone in young Allison’s life.
So the Comstock board members’ ties to Baylor were noteworthy. There was Dr. Elizabeth Davis, who spent 22 years at Baylor in several roles up to Executive Vice President and Provost. Also of interest was David Sledge, who played on the Baylor football team at the same time as Jay Allison in the 1970s, before he spent 22 years as a director on the Comstock board, while serving as senior management of ProPetro.
The oil and gas community is an insular one – fine, we suppose. And so too was Dallas-based business community. The outside directors without a Baylor connection were almost all tied to Dallas. There was the Dell exec. And the NSAI co-founder-cum-E&P CEO with Dallas HQ. Then there were the headscratchers in the former CEO of a Dallas-based Dr. Pepper bottling company and an independent commercial real estate investor based in … Dallas.
Finally, there was Morris Foster, a name we’d known and held in high regards after a lengthy career at ExxonMobil. We’re frankly not sure how he ended up on the Comstock board. Good add though, to be fair.
All in all, not the breadth, depth, diversity, or expertise we’d categorize as the best for a small cap oil and gas producer.
The board awarded CEO Allison $5.9 million in 2017 including a base salary of $825k, $1.3mm in cash bonus, and another $3.7mm of stock awards, deferred comp, and other compensation.
Individual bonus awards were evaluated based on the achievement of financial, strategic, and operational objectives. For 2017, the bonus components and goal levels were as follows:
60% of the bonus would be determined by production and reserve growth, 15% by operating cash costs, and 25% in a discretionary bucket that considered other strategic objectives. Comstock grew production 35%, replaced 381% of reserves, and reduced unit operating expenses. Three of the four “other key objectives” were met, but the proxy is vague on which criteria were met or how they were assessed.
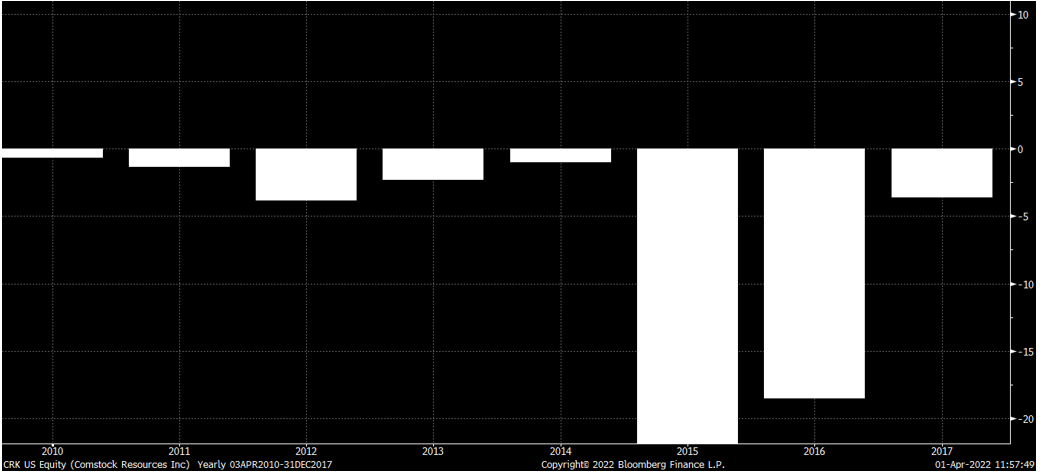
The company outspent cash flow in 2017, again.
CRK Cash from Operations – Capital Expenditures
And kept ROIC negative at -3.6%
CRK Return on Invested Capital
The stock ended the year down 12% at $8.46, after running as high as $13.07 and as low as $4.14.
For this, the board paid the CEO $6mm while the shareholders lost and were left with a company over 5x levered (TTM). Would a board comprised of different directors - some younger, some less tenured, some with more relevant experience, some without ties to senior management – have prescribed different performance objectives better aligned with shareholders seeking appreciating equity value and improved condition of the company and/or awarded the CEO lower compensation? Perhaps.
Anadarko (APC)
Comstock is easy picking as a parochial, pre-ESG small cap E&P. It’s to be expected, if not excused. But a Hall of Fame contender for questionable board allegiance goes to Anadarko Petroleum’s in the leadup to the company’s sale to Chevron at first, then Oxy in the end.
The story speaks for itself. On literally the day before announcing a merger agreement with Chevron, Anadarko’s board approved additional payouts to executives, especially CEO Al Walker. The changes in severance terms ensured he’d walk away with $3-67 million more in hand than he would have under the prior severance structure. This after he’d earned $51.2 million between 2016 and 2018 during which time the stock was flat.
Anadarko Changed CEO's Potential Payout
APC vs S&P 500 2016-2018
APC even underperformed its peer group and the board still gave him the payout bump right before the CVX deal was announced. APC stock performance was 8 out 12 in its own self-defined peer group 2016-2018.
To this day, we struggle to see how the board found it in shareholders’ best interests to increase the CEO’s personal payout the day before the merger was announced.
APC ROIC
On the other end of the board spectrum, and briefly because it’s nowhere near as fun, here is an example of what we consider to be a good board - ConocoPhillips. Diverse backgrounds, professions, expertise, tenures, and ages.
Although … we can’t help but notice Mr. Al Walker’s seat at the table. No board is perfect, but we wouldn’t mind a different former E&P CEO as a director at the next reshuffling.
COP Board
CEO Ryan Lance is paid a lot. $24mm in 2021 according to the proxy. But as shareholders we’re aligned with the incentive program in place and are fans of the way in which Lance has led the organization in achieving the goals set by the board.
The point is to illustrate that the board is supposed to guide management in pursuit of objectives that are meant to be to the benefit of shareholders. Management teams will do what they’re paid to do and seek to maximize their personal compensation in delivering on goals set by the board. The shareholder wants a board who represents their interests and is not de facto working for management.
Boards matter.
Executive compensation is broken into fixed and variable, at-risk elements. Compensation is awarded in the form of cash and stock.
Base salary is base salary and they’re all remarkably congregated around a similar line in the sand across the industry. Large cap CEOs make a little over $1mm base; smaller caps make a little under $1mm. Our exercise here focuses the variable cash component (bonus) to executive compensation. Long term incentive programs are a separate bucket we’ll cursorily address further down.
We study annual bonuses because they drive executive decision-making in the short term.
In evaluating executives’ bonuses, the board’s compensation committee sets a target bonus level, measured as a percentage of the base salary. It then establishes a number of performance goals (operational, financial, strategic) and sets a weighting of each goal in calculating the final bonus.
EOG Performance Goals
If the committee assesses a performance goal as having exceeded the target objective, it results in a performance award of over 100%. Up to a limit, the better the company’s performance fares relative to a given metric, the higher is the bonus awarded.
Most energy executives’ compensation is composed primarily of long-term incentive awards in the form of stock options, stock appreciation rights, and restricted stock.
APA 2020 Compensation Program
We’ve ignored long-term incentive compensation from our analysis for a couple of reasons. It’s long-term and less subject to short-term management decisions. It’s also often time-based compensation, meaning the executive just has to stay in their seat to receive the comp. And for the portion that is performance-based, the award is almost always function of the stock’s relative performance. Even if the stock goes down, the executive still gets the compensation, the worst they can do is have performance-based compensation capped at a lower payout amount. All they have to do is stay in their seat.
Long term compensation is free money.
It doesn’t drive management behavior like the annual bonus programs.
E&P Long Term Incentive Program Metrics
Hopefully with an appreciation for how the board drives management and management drives the organization, we turn to industry-wide incentive structures. Under the premise that today “this time is different” and the industry has changed its stripes this cycle relative to prior cycles, we look at a comparison between 2017/2018 objectives and 2020/2021 objectives for annual incentive programs – the cash bonuses.
Have boards in the aggregate repositioned to 1) further focus on shareholder representation and 2) developed a better appreciation for those factors that actually drive stock performance?
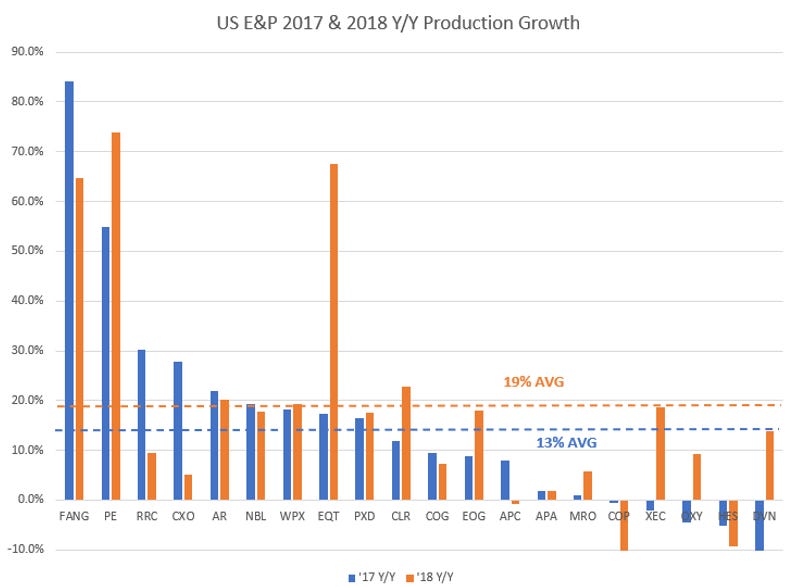
We start with the 2017/2018 period as it marked the largest y/y growth of North American production - the heady days of uber-growth and no returns. Understand that some of the biggest outliers below were driven in part by acquisitions, but the reader will get a feel for the industry’s appetite for production growth at the time.
What did boards pay management to do 5 years ago and how does it compare to what boards paying management to do today? What was considered good performance then and what is it today?
Tell me now
show me how
to understand
what makes a good man*What Makes a Good Man? The Heavy, 2012
*What makes a good (wo)man for OXY
Reading through annual and merger proxies over the last few years, it becomes clear that often managements and boards do not have a firm grasp on what drives stock performance. They listen to bankers’ narratives. They solicit feedback from selected shareholders. They follow peers into newest trends. They react.
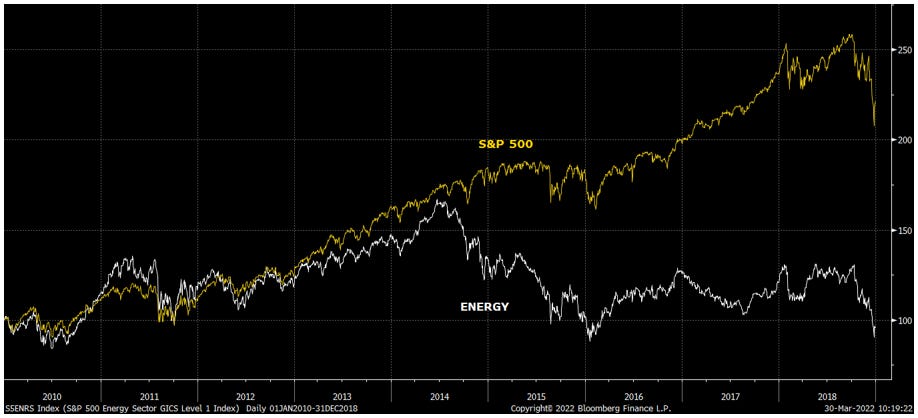
From our perspective, managements in general, and outside directors in particular, demonstrate only a partial understanding of the macro and micro factors that drive absolute and relative performance of energy stocks – particularly during the pre-COVID decade that saw Energy underperform just about everything. Isn’t the point of having public equity to maximize the value of the stock? Why aren’t there more equity analysts like Arjun Murti (COP director) on company boards?
Normalized performance 2010-2018 Energy vs S&P 500
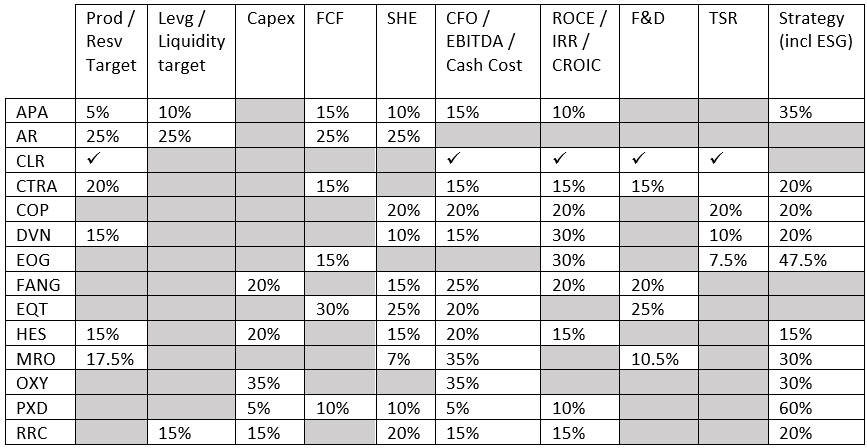
We reviewed the 2018 proxies of the 20 largest US independent upstream producers and did our best to aggregate them into 9 discrete categories:
Production & Reserves. Targets varied with objectives at times expressed as a % growth number, other times adherence to company plan. In a high growth year like 2018, nearly every CEO was paid to grow production
Capex. Execution of capital budget vs plan
TSR (Total Shareholder Return). A measure of stock price performance, almost always expressed relative to an industry peer group
SHE (Safety Health Environment). License to operate metrics pertaining to well being of employees, operations, and
Cash (Cash Flow From Ops / EBITDA / Cash Costs). Various metrics intended to maximize cash flow and margins
Strategy. In some instances left deliberately vague “execution” or “succession planning,” other times more qualitative but discrete objectives
F&D (Finding & Development). Unit cost of drilling and booking new proved reserves
ROCE. Corporate financial returns targets
Leverage Targets. Mix of absolute debt target levels and leverage ratios such as Net Debt/EBITDAX
2017 metrics (2018 proxies) for annual bonus/incentive programs & category weightings (%)
2018 observations
Nearly every company in the producer group incentivized some form of production and/or reserve growth with an average 22% of management cash bonus depending on this growth metric
Little attention paid to capital costs either in the form of capital expenditures or F&D
Encouraging participation in SHE incentives. As an old supervisor used to say “the team that pays attention to safety pays attention to financials”
Predictably little emphasis on corporate ROCE with fewer than half of companies stewarding management on financial returns. Average weighting across the group, including the 0% weights, was 8%
Highest consistency amongst incentives were the Cash measures and Strategy groups. The former sought to maximize current year cash flow and the latter generally functioned as a discretionary category for boards to sidestep formulaic computations in awarding compensation
Takeaway for us is managements were paid to grow.
Fast forward to the most recent proxies (we use 2022 proxies where available, 2021 otherwise).
2020/2021 metrics (2021/2022 proxies) for annual bonus/incentive programs & category weightings (%)
2022 observations.
Smaller sample size thanks to M&A. APC bought by OXY. CXO bought by COP. NBL by CVX. PE by PXD. WPX/DVN merged, as did XEC/COG into CTRA
Dramatically reduced participation in any production/reserve growth targets. For those that have production or reserve targets, they are to meet measured absolute levels and not hyper-growth targets. Illustrated below, the average production growth expected in 2022 and 2023 are well below those contemplated in 2017/2018 (COG [CTRA], COP, CLR on high end due to 2021 acquisitions)
Higher emphasis on SHE, with an average weighting of 16% vs 12% in earlier sample
Free cash flow (FCF) a new category, with strong adoption. Boards have explicit mandates to generate excess cash flow, with an average weighting of 18%
Broad implementation of financial return metrics, with near the entire group participating. Average weight is 18%
Strategy remains in widespread use, though our qualitative assessment finds proxies generally do a better job of specifying key strategic expectations
The combination of comprehensive ROCE-like and FCF metrics, paired with tempered expectations on growth and capex do indeed demonstrate an industry-wide pivot from return-less growth towards stability and cash flow generation, with an implied expectation of increased shareholder capital returns.
Up to here, we’ve tried to demonstrate that boards incentivize management behavior and that today management teams are incentivized to generate financial returns and free cash flow over production growth in a marked change from the last up-cycle.
Understandably fighting the last war, the entire industry has overhauled incentivize structures to discourage production growth at precisely the time the market is calling for the opposite.
Who has two thumbs and works to ensure they get paid instead of adding supply to a market in deficit? An E&P CEO today.
Despite a staggering increase in commodity prices, the rebound in energy capital expenditures in the post-COVID rebound have fallen well short of what expectations might have been using the 2016-2018 cycle as precedent.
US horizontal rigs vs crude strip
We conduct a brief case study on the financial incentives that might come into play for an operator contemplating a higher activity level in 2022. Pioneer has guided to 2022 production of 623-648 mboed on a capital budget of $3.3-3.6 billion that would bring online 475-505 wells from the operation of 22-24 horizontal rigs in the Midland Basin. At current commodity prices, this plan should yield over $8 billion in free cash flow.
We see from the 2021 proxy that CEO Scott Sheffield’s bonus is a function of free cash flow, CROCI (and ROCE according to the proxy), and hitting the capital budget.
Let’s assume Sheffield wants to chase higher commodities and add 5 rigs to the company’s 2022 program. First production from these new wells might show up by 3Q in small amounts, with a larger impact in 4Q22 onwards. The incremental capex would of course show up immediately. We estimate adding 5 rigs to the plan in 2Q22 would raise total company production by 1% for the yearly average. The other impacts of a higher activity level relative to the current plan:
Assuming the board doesn’t modify his performance goals to accommodate higher capex, Sheffield risks a lower 2022 bonus by adding rigs at this point thanks to dilution in his performance metrics. His personal interests are better served by baking in a rig ramp to the 2023 budget during planning season later this year. Why risk 2022?
In this final section, we’ll try to show that even if managements wanted to ramp capital expenditures in chasing higher commodity prices, they cannot. Dogma and logistics.
III. Bottlenecks
Conditioned by investors and boards to keep spending on a short leash, E&Ps are aware of the impediments to further accelerating capital spending to increase production. E&Ps cite labor trucks, pipe, rigs, frac equipment, among several barriers to ramping capital expenditures. Told by equipment and service providers that calling for more activity will invariably result in higher pricing and uncertainty on deliverability, they’re choosing to keep plans unchanged so far. Selected E&P bottleneck commentary:
APA: “Truck drivers out in West Texas. Chemicals, fuel, there are pressures in the system and steel and everything else that's going up, especially on some of our longer-dated things.”
COP: “It (inflation) is on certain commodities of spend like tubulars, trucking, labor, chemicals, OTCG those kinds of things and primarily in the more active parts of the Lower 48 like the Permian today.”
EOG: “I'm sure you've heard the same comments from many of our peers about the supply chain constraints in the industry is seeing across all the sectors, certainly on the drilling rig side, there's certainly most of the active super-spec rigs are being, are deployed and active today. There's not a lot of new pieces of equipment that can come into the market. The same is true on the frac side of the business, most of the good equipment is already under employment today. And then bringing in new fleets, both on the drilling side and on the frac side, is challenged also from the standpoint of attracting labor to the market.”
For PXD, it’s a problem, but not for them. “a lot of companies, a lot of the privates are experiencing labor issues, cost issues, can't get equipment. So, that's going to prevent the rig ramp up.”
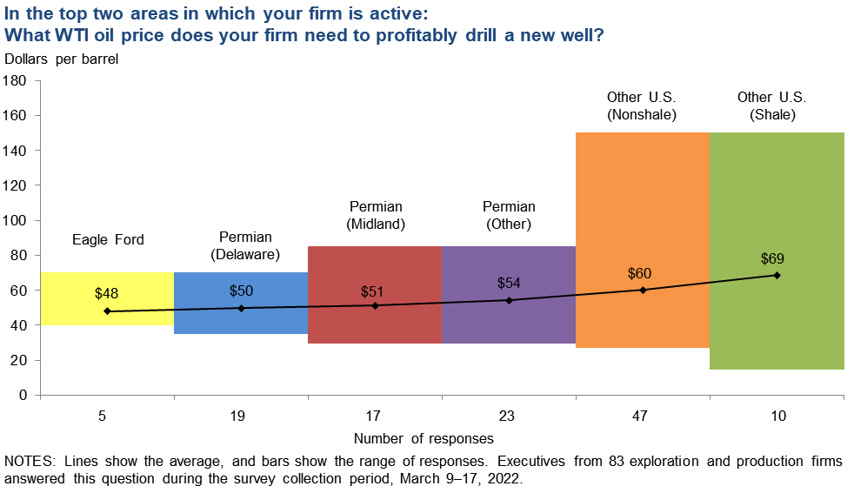
This survey from the Federal Reserve Bank of Dallas demonstrates clearly that the 139 surveyed producers are well aware that their future drilling prospects are deep in the money today. Large firms producing over 10,000 bbl/d need $49/bbl on average to profitably drill. Yet the median expectation of 4Q21-4Q22 for company crude production growth for surveyed firms was only 6%.
Nearly 60% of E&P executives cite capital discipline as the driver behind restrained growth. As we’ve noted, boards have reinforced investors’ capital discipline mandate via altered compensation metrics.
For OFS, a similar story, and less vague than E&Ps who are a step removed from the supply chain. Public commentary points to bottlenecks across the system. Service providers, hungry to recoup pricing/margin concessions made to E&Ps during COVID, are exercising similar capital restraint and focusing on increasing profitability of assets in operation. With limited spare capacity across many OFS business lines, providers are inclined to reactive idled equipment only with economic incentives. There is a widespread dismissal of plans to build new equipment.
Drilling rigs. Tight market today, drillers willing to bring idled equipment off sidelines for a price. No newbuilds.
HP: We're currently experiencing a very tight market especially for rigs that were active just prior to the pandemic hitting the US in March of 2020… we plan to continue to push pricing in the coming quarters as the scarcity of readily available super-spec rigs becomes more prevalent… we need substantially higher pricing in order to generate the returns required to attract and retain investors… we see current pricing environment as an impediment to the capital investment required to relieve the tight supply of capable rigs
PTEN: the market for Tier-1 drilling rigs is tight and premium rigs are receiving a higher day rate. The market is much tighter than what is apparent by just looking at the market for super-spec rigs… all of our Tier-1 super-spec rigs in the Permian Basin are currently contracted.
Pressure pumping. Increasingly tight, especially for higher tier equipment. A lot of excess capacity was idled during the last downturn, uncertainty reigns on quality and true availability of this equipment. Like rigs, spare mothballed capacity comes at a cost. No newbuilds – except upgrades to e-fleets.
HAL: “The North America completions market is approaching 90% utilization and Halliburton is sold out. Anticipated demand growth for equipment provides a runway for us to increase pricing throughout the year… We believe we thrive in this type of environment and managing or maintaining CapEx where it is. Look, it's a 5% to 6% of revenues. In my view, this very much is a show-me story, and we expect to deliver returns and we do things ratably. And strategically, we view North America as maximizing value in North America. That means managing the right level of spend, the right type of technology, the right pacing of equipment.”
PTEN: “Pressure pumping pricing has improved at the leading edge. And in 2022, we are focused on maximizing overall profitability of our 12 spreads. We do not have any plans to activate additional spreads… it's around five spreads that we could activate, but right now we just don't have plans to do so. It is just not is on our plan. It's not on our radar.”
NEX: “the fleets that are still available to recommission have not worked in several years and will require capital investment as high as $20 million to return to work”
PUMP: “higher demand for pressure pumping, continued equipment attrition, and the risk of supply chain issues on equipment deliveries, sets up an environment, where the North American pressure pumping market could be if effectively 100% utilized during the 3rd quarter of this year… Even though we have additional assets to put toward, we see very little upside in marketing more capacity, prior to achieving proper economics on all active fleets.”
KEX: “expect to see higher demand for transmissions, engines parts and service and distribution. … due to ongoing supply chain issues, new equipment deliveries are expected to progressively ramp up through the year, with the first quarter being the lowest of the year… One of our major suppliers of a key component for what we're doing on electric frac basically just in the last month has told us that lead times have gone from 32 weeks to 52 weeks. That's all supply train driven so that supply chain has been the bigger constraint for us to deliver than labor.”
LBRT: “Within the frac market, two years of supply attrition and cannibalization plus limitations from labor shortages, and a secular shift towards next generation frac fleet technologies has led to tightness in the frac space.”
USWS: “supply chain disruptions affected the availability of truck drivers, proppant and water required for efficient pressure pumping operations, which in turn limited our pumping activity. These challenges have persisted into the first quarter of 2022. Availability of workable equipment, experienced crews, and materials used in pressure pumping operations remains limited, and service companies have demonstrated capital spending discipline on new fleets and are not replacing aging equipment.”
US frac fleet supply/demand
Sand. Pricing tailwinds on sand as supply has been affected by labor shortage at mines and transport. Sand market especially tight in oilier Permian and Eagle Ford basins.
SLCA: “As local sand availability tightened in the Permian, we began selling Northern White sand from our local network to assist key customers with their well-completion needs. Given the very tight supply and demand balance in the market, we saw prices for sand and last-mile logistics increase throughout the quarter and that trend has continued into 2022 … we are essentially sold out of sand proppant, and we are seeing meaningful increases in spot and contract prices for both local and Northern White sand. The combination of increased customer demand and reported operational challenges at competitors’ mines are further exacerbating what was already a very tight market”
USWS: “Company's operations were adversely impacted by both the lack of truck drivers and an inability for our customers to obtain all the sand and water required for use in our operations.”
US PPI Hydraulic Fracturing Sand
Labor. Not unique to energy, but having issues building work force across the space.
PTEN: “Labor is definitely tight, which means we have to work harder to recruit new people into the industry as we continue to grow”
KEX: “hiring people now is more challenged than it has been, we are still able to bring in new technicians, new assembler, it's getting more difficult”
JBHT: “across our business, the common denominator in terms of our pain points continues to be labor related in wages, salaries, benefits, and recruiting trends, in both driver and non-driver… driver wages are up significantly pretty much in every division. Our cost per hire is up. We've seen higher sign on bonuses and the market is very, very difficult with the drivers being out there facing COVID.”
Trucking/Transport. Labor and equipment availability pressures pricing and lead times.
NEX: “consider the well-known shortage of tractor-trailers and truck drivers across the U.S. today. This creates unique challenges in the oilfield where more than 2,000 truckloads of sand and commodities are needed for the completion of a typical shell well pad.”
SLCA: “we'll see continued issues in the supply chain. And if you think about it, operational issues, staffing issues and trucking. It seems like we're going to see two or three of those at almost any given time, the way we look at it for the rest of the year. So I think that will definitely keep a lid on supply and we expect the demand is going to be very strong… things are pretty tight with the rail today also and it's another reason that I think the supply chain bottlenecks will continue. It's tough to get power sort of get an engine to come to your site and hook up to your railcars. And one of the other issues that the whole industry is having right now is that, the cycle time to get your empty railcars back to your sites so you can refill them.”
Dry Van Rate per mile
OCTG. Global commodity price surge filters through to oilfield pipe.
TS: “US spot market OCTG prices has represented by the Pipe Logix index have reached their highest level since 2008, after rising 124% since October 2020 as distributor inventory level as well from 10 months of consumption to four months of consumption… on the Pipe Logix HRC supply-demand. On the one hand the strong demand and in our opinion the ramp-up that the industry will need to put together to face with the demand the inventory level is extremely low. Now, in our calculation, we are likely to be low four months and this is historically low for this market. So there is also a matter of somewhat replenishing this inventory.”
North America OCTG P110 Pipe 5.5” FOB
Other supply chain
KEX: “I would tell you though our biggest problem is the supply chain. We are having problems getting key componentry.”
JBHT: “I can't say that I feel optimistic about the supply chain challenges going away in the near-term. We are focused on making sure that we help our customers be right to help them smooth out their supply chain challenges and that we are there for them.”
NOV: “All three segments struggled this quarter with supply chain challenges that we did not foresee along with mix issues and COVID disruptions related to the emergence of Omicron variant during the fourth quarter. And while we expect these to subside longer term, we now expect supply chain headwinds to continue to persist through the first half of 2022 as our vendors continue to push out their delivery commitments to us… our manufacturing scheduling headaches were compounded by component and raw material shortages and late deliveries from our vendors, who are facing the same sorts of challenges that we are, late deliveries and short shipments of raw materials and subassemblies led to further and efficiencies under absorption and higher product costs in certain areas as our creative work for scrambled to make do with the raw materials and components that they had on hand.”
So much of the future growth from North American oil will come from the Permian basin.
Horizontal rigs by basin
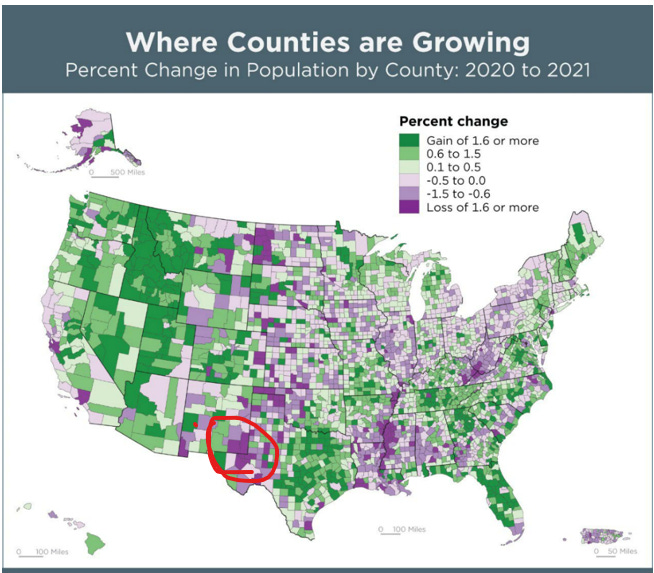
Where capacity is tight, especially for labor. Staffing is set to be a persistent impediment for the area which actually lost population during the COVID downturn.
Population % change 2020-2021
The Midland labor market is already looking tight. We wonder bemusedly if the natural unemployment rate in Midland is structurally higher than the rest of the US thanks to regular job-hopping. Regardless, the unemployment rate is low.
Midland unemployment rate
On a labor force that has shrunk.
As it stands on the eve of 1Q21 earnings reports, the public E&P companies are holding fast to their commitment to capital discipline. E&Ps are forecast to generate more cash flow in 2022 than ever before.
But the group is not spending like it had in prior cycles. Capex guidance for 2022 is remarkably muted relative the outlook for cash flow generation.
Leading to a historically (positive) wide gap between the cash flow and capex – much of which will be returned to shareholders.
It’s not that the group isn’t growing production at all – it is. It’s just that the group is not inclined to grow much more than already planned. At least for 2022.
The longer the group takes a measured approach to spending in the face of commodity price strength, the longer the cycle lasts.














Excellent article
Great work. Very informative as always