Two objectives, in order of priority:
Capital preservation
Process-driven, consistent, positive risk-adjusted returns
PROCESS
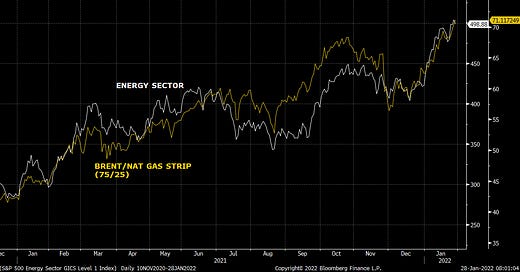
Energy equities follow commodities (predominantly crude).
Energy equities vs oil/gas strip since COVID vax announcement
Crude timespread momentum drives crude price momentum.
Brent timespread vs Brent strip
Timespread change vs flat price change
Timespread momentum follows the marginal product crack.
International refined product cracks vs Brent timespread
Over the medium term, because it is a physical commodity, crude price follows global inventories…
Brent vs OECD crude inventories
and Emerging Markets growth trends.
BRICS GDP vs Brent strip
The generic energy cycle consists of inventory build and inventory draw periods.
Draws = bullish
Builds = bearish
OECD crude inventories vs Brent strip
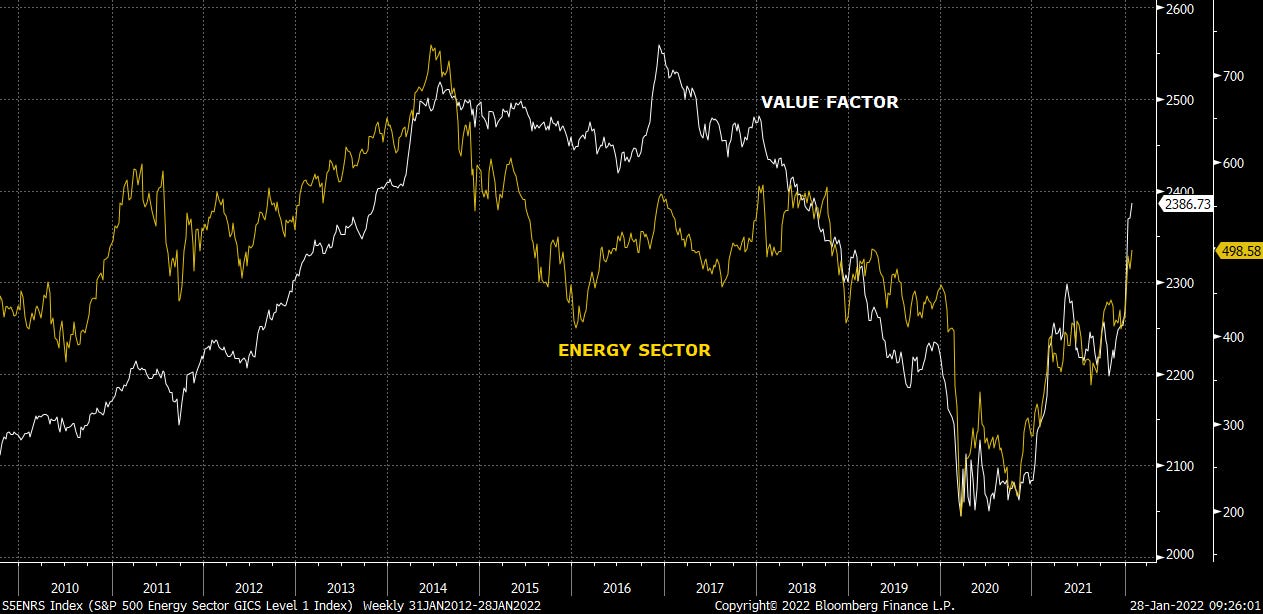
The ultimate risk-on sector thanks to its sensitivity to economic growth, Energy closely tracks the performance of the Value factor.
Energy vs Value Factor
In addition to commodity prices, the performance of Energy equities in the public markets is tied to a number of other macro factors. We try to cast a wide net when assessing the trajectory of the group.
Energy equities vs (undisclosed) macro inputs
POINT/COUNTERPOINT
We christened this newsletter Devil’s Advocate in an exercise to acknowledge the merits in testing or challenging consensus. This is not meant to be dogmatically contrarian, but will certainly endeavor to test conventional thinking, as well as our own.
The Israeli Mossad has a similar informal rule we admire - informally referred to as the 10th Man Rule. The directs the 10th man in a group to argue the inverse of a decision if the other 9 have reached consensus. We’re the 10th man in Energy today in this Point/Counterpoint section.
Find us an analyst bearish crude or energy equities. We cannot recall a time when consensus was this universally bullish the Energy sector. Food for thought.
Two charts below show relationships between variables. Which of the two would you incorporate into your process of deploying capital?
Chart #1
or Chart #2?
We prefer chart #2. Eyeballing it, we contend there is at least a directionally consistent relationship? As x-axis values increase, y-values decline. We see no such relationship in chart #1. Yet, the market prefers #1 - in spades.
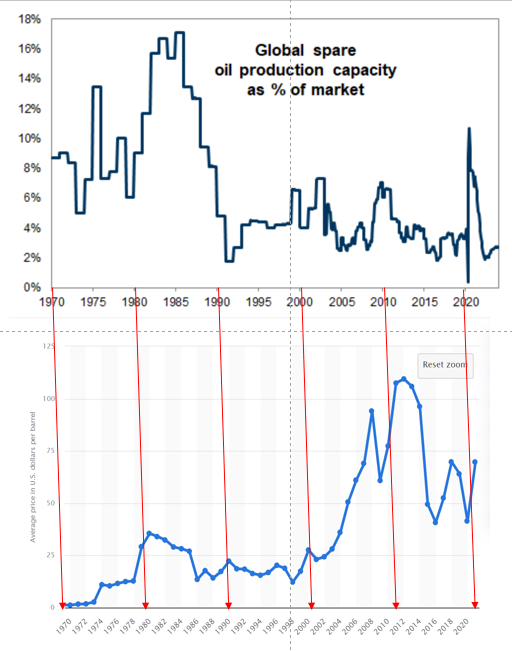
(Consensus) point #1 - No capacity: OPEC spare capacity is running so low that it will force the crude curve higher to incentive supply.
Counterpoint: There is no relationship between OPEC spare capacity and crude price. The lack of relationship suggests that the calculation of OPEC spare capacity is quite wrong and/or it doesn’t matter to crude price as much as other factors.
Chart #1 was the relationship between OPEC spare capacity and crude prices.
OPEC spare capacity vs Brent strip
Chart #2 was the relationship between OECD crude inventories and crude prices.
OECD crude inventories vs Brent strip
So then, why the incessant hammering of OPEC spare capacity shortage across the world of energy punditry? We see no applicable relationship using history, why would this time be different? Why relentlessly pound an inconsequential, contrived data point and ignore a more pertinent one?
OPEC spare capacity vs Brent
Do not overlook the fact that every agency and every bank shows crude inventory builds in 2022. They just tend to dismiss the builds as less meaningful than every prior cycle for any number of reasons.
US EIA International Petroleum and Other Liquids Production, Consumption, and Inventories
(Consensus) point #2 - Energy works when Fed hikes: Commodities outperform during Fed rate hiking cycles. Buy commodities & commodity producers & Value.
Counterpoint: This hiking cycle is unlike prior hiking cycles in that the Fed is hiking into slowing growth and declining inflation. Energy rallied into and faded out of the first hike of similar the last time similar conditions were present.
Fed funds vs US GDP (consensus used for 2022-2023)
Fed funds vs US CPI (consensus used for 2022-2023)
The setup today is most like the 2018 hiking cycle. How did Value fare into and out of the hiking cycle? It rallied hard all the way into the first hike and then faded all the way through the actual hiking cycle.
2016-2018 Hike Cycle Value Performance
We find a similar trend looking at Energy relative to the S&P 500. The sector rallied off the ‘16 lows into the first hike and underperformed all the way down into the last hike.
2016-2018 Hike Cycle Energy vs S&P 500 Performance
How are things trending into this pending rate hike? A portfolio long high Value and short low Value has returned nearly 50% in the last six months. Consensus expects the first hike of this cycle in March ‘22 - less than two months from today.
Equities go up through some combination of either earnings growth or multiple expansion. We just don’t see a high likelihood of the Energy multiple expanding during this rate cycle, mainly because the Energy P/E multiple compressed during every other hike cycle over the last 30 years.
History suggests that Energy earnings need to go up from here, with crude at $90, for the equities to appreciate further, because the multiple isn’t going to go up.
Energy P/E vs Fed Funds
(Consensus) Point #3 - Valuation. Energy valuation is compelling any way it’s sliced. The argument normally goes something like “Energy is trading cheaper to the market than it ever has.” Presumably this is a catalyst for outperformance.
Energy NTM P/E vs S&P 500 P/E
Counterpoint: Well, the discount makes sense, given relative spread in index composition, volatility of earnings, and disparity in profitability.
Remember, in the market, the term “Value” is the polite way to characterize a low quality business. They’re cheap (ahem, high Value)_for a reason.
An equity commands a higher relative multiple due to higher returns, lower volatility of earnings, and higher growth visibility than peers. Energy struggles to consistently deliver any of these criteria - it is a cyclical sector after all - so it garners a lower multiple.
As the S&P 500 has transition a more tech-heavy index, its returns have been more robust and predictable relative to Energy.
Energy vs S&P 500 Return on Equity
S&P 500 has been a more reliable bet for consistent earnings growth.
Energy vs S&P 500 forward earnings per share
Given the sector’s toque and sensitivity to economic activity, in our mind a better comp is to the Russell 2000 index. Energy does historically generate a higher ROE than the Russell.
Energy ROE vs Russell 2000 ROE
Though with higher earnings volatility than the Russell 2000, the Energy sector trades at discount. Today’s discount is about in line with historical norms - apart from periods in which Energy traded at a P/E premium due to earnings implosion (‘14-’16, ‘20).
Energy P/E vs Russell 2000 P/E
There is a tangential argument that often comes alongside the broader valuation argument in favor of energy that calls for a re-rating as commodity prices rise. Let’s explore.
Energy earnings estimates have risen with commodity prices.
Energy forward EPS vs Brent/Nat Gas
Does the market then “re-rate” the inflated earnings stream with a higher multiple?
This does seem to run counter to how they teach you trade cyclical sectors at Hedge Fund School.
Peak earnings = trough multiple
Trough earnings = peak multiple
How about Energy’s history? Today’s 75/25 Brent/Nat Gas strip is trading at roughly $70/boe. The prior periods that saw equivalent levels of futures prices found the sector trading 10.4x - 12.0x P/E ratio.
Energy is trading at 12.0x fwd estimated earnings. We contend there should be no sustained multiple expansion from here.
Energy P/E vs forward commodity prices
IT’S NOT ALL BAD NEWS
US natural gas inventories in line with the 5yr average today
US natural gas inventories
and supply will resume the march towards pre-COVID highs after weather curtailments are restored once as we near spring.
We’re not bullish on the prospects for US nat gas or US nat gas producers from here.
The two products that are constructive today however are international natural gas and global distillate. We dug deeper in an earlier dive:
Suffice it to say an acute European gas supply shortage morphed into a storage crisis and prices have been firm.
Europe Natural Gas Storage
Higher European natural gas prices pulled Asian nat gas prices as well …
International natural gas prices
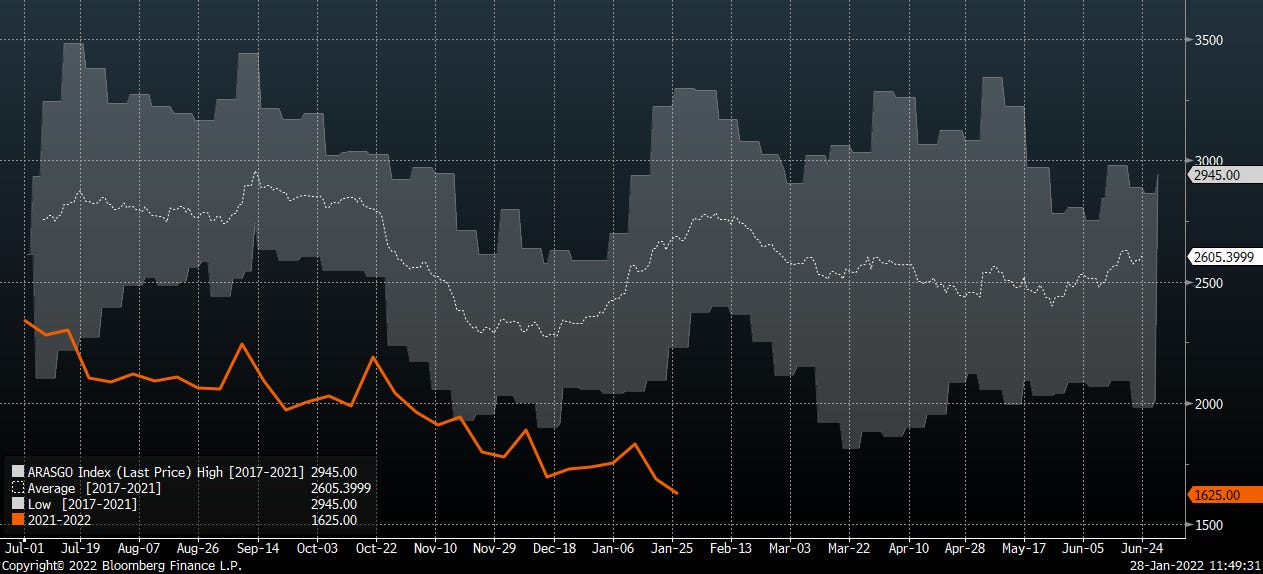
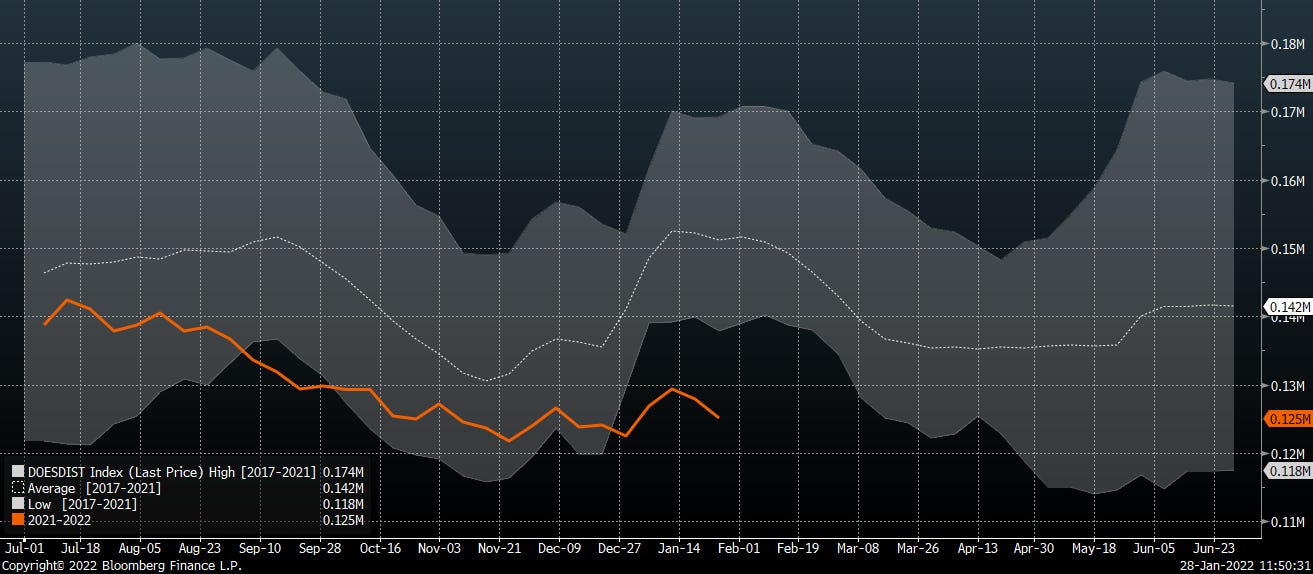
and have been partly responsible for a deficit in global diesel inventories. Distillate inventories in Asia, Europe, and the US are below seasonal norms.
Asia middle distillate inventories
Europe gasoil inventories
US distillate inventories
The shortage in diesel everywhere has bid up the absolute product price and widened cracks.
Regional distillate cracks
This is the good news for the bull. As long as international gas prices stay elevated and distillate inventories stay depressed, we expect the energy commodity complex should stay bid - apart from US natural gas.
Though beware, a diesel shortage is considerably different from a crude oil shortage in that it can be remedied much easier. When we see indications of said remediation, we’ll pivot much more defensive in our risk allocation.
POSITIONING
The Fed is hiking into a macro tape that would already been moving towards balanced/risk off position after peaking economic data. We are not betting on sustained Energy outperformance.
Equity returns under ISM & Fed regimes
We anticipate limited earnings revisions and no multiple expansion for the Energy sector. We are not constructive US nat gas producers and view risk as squarely to the downside. We believe downstream names are printing their best quarterly earnings of the cycle with 4Q results and are not constructive these names.
We’re relatively more constructive liquids producers on earnings revisions potential and pockets of large cap OFS on positive earnings hopes.
Across the book we’re net long quality over beta/garbage, oil over gas, upstream over downstream.
Trades 1/28
Adding MUSA-SWN long-short pair, wanted to increase short exposure to nat gas and been waiting on SWN to have an up day.
Feedback always welcomed.








Thank you! Will read this religiously as I'm sure >90% of the energy investment community will. Is there a valid counter-argument that the Fed and most big bank CEOs are correct that in fact the economy is strong enough to support/necessitate this hiking cycle, unlike 2018? Oil prices are typically correlated to rates bc of economic growth torque, as you point out...maybe this hiking cycle is actually well timed? (fwiw I agree the oil complex is tied up in EU nat gas, which is also driving distillate strength via heating switch and refinery fuel issues).
great article except the one thing I didnt see is the comparison of shale DUCs, shale production growth (lack thereof), as well as capital expenditures during this cycle vs the previous 2016-2020 cycle. The restraint of shale in this new cycle is quite bullish for energy prices
Also, what's another NEW factor that is completely ignored is ESG investing and shifting of capital away from "dirty" energy to "clean" energy, which has the intended consequence of 1) reducing production (related to shale discipline) and 2) raising the cost of capital and therefore the cost of oil production.
Comments?