Natural Gas: The Simplest Hydrocarbon
Normalizing European natural gas prices are an underappreciated downside risk to global crude prices
It’s time for a revisit on state of affairs in natural gas land.
A primer: natural gas flows from regions long the commodity (North America, Qatar, Australia, Russia) to regions short it (Europe, Asia).
2020 natural gas major trade movements (billion cubic meters)
We begin in Asia - epicenter of LNG imports.
Recent interesting news flow started with a noteworthy update out of Japan. As the world’s largest importer of Liquefied Natural Gas (LNG), Japan’s disclosures in the market carry weight.
Japan LNG imports by source (billion cubic meter)
Japan’s Ministry of Economy, Trade, and Industry reported that as of Jan 9, LNG inventories had dropped 7% from the prior week. A drop in LNG inventories in the heart of winter after heavy snowfall was not particularly special, but the data were.
Normally, METI reports LNG inventories on a lagged basis, but was generous enough to disclose more recent data points than the last data shared with inventories as of end of October 2020.
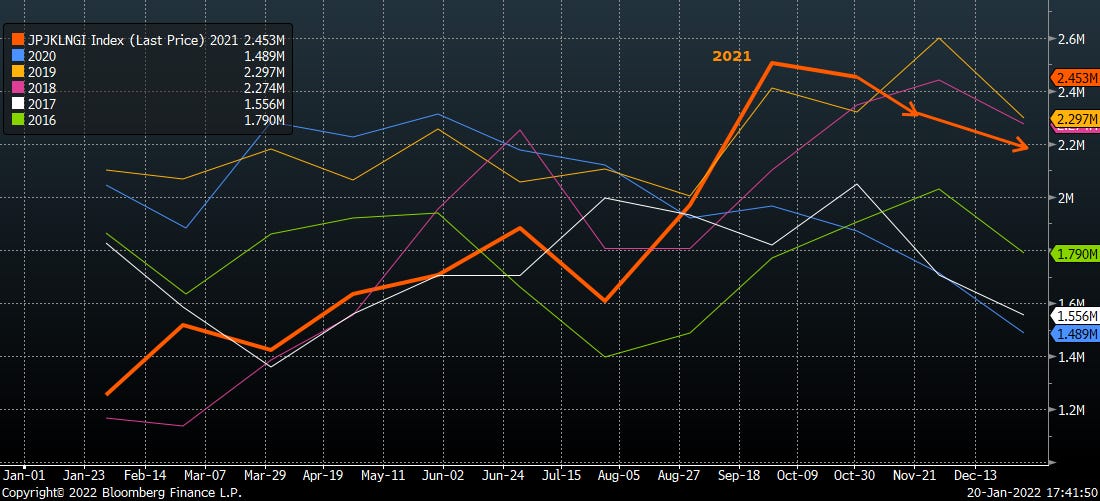
The release shared multiple data points up through the first week of January. The most pertinent conclusion for our take though, was that LNG inventories were some considerably higher than the prior year’s level at the same calendar week. We’ve extrapolated 2021 inventories (orange) below using METI’s disclosure.
After the headlines of a global gas shortage this winter, it is noteworthy to see Japan’s LNG inventories running +45% year on year and near 5 year highs. Japan did a fine job restocking during the off months in 2021.
As did their neighbors in South Korea.
Passing this coldest average week of the year now, Asian countries are finding inventories are starting to look adequate to weather the remainder of the winter.
A similar situation was unfolding in China, which had a record year of LNG imports in 2021.
China now finds itself enough breathing room to put some of their landed LNG up for bid in an effort to try to monetize a price spike. State-owned Sinopec is offering up to 45 cargoes for Feb-Oct delivery. Big, not huge volumes. For reference, if the total volume were sent to northwest Europe, it would represent just over 10% of current storage levels in the region.
45 cargoes isn’t earth-shattering, but it’s material, especially when regions of the globe are experiencing acute shortness of inventories. Asia LNG prices got clipped pretty hard after the news of Sinopec’s LNG offers.
Observing a loosening market in Asia, we pivot to Europe, where headlines on a persistent natural gas shortage abound.
With regional demand far in excess of production, northwest Europe is dependent on natural gas imports for balance.
The bulk of the deficit comprised of pipeline imports from Russia, with additional supplies coming from North Africa via subsea pipeline in the Mediterranean.
Europe natural gas imports by country
Trouble with Europe’s natural gas pipeline imports started to manifest beginning late summer 2021, when volumes from Russia began to tail off. There is no shortage of speculation as to the cause of reduced flows, but this is beyond the purview of this analysis. Suffice it to say, Russia natural gas volumes into Europe have fallen considerably.
Ground zero is European natural gas inventories, where concerning deviations started in mid ‘21 as levels drifted from below average to well below the 5 year low as Russian molecules simply didn’t show up as expected/hoped.
The deficit vs normal expanded from summer into fall. Falling well short of initial expectations, inventories topped out at the peak of reinjection season at only 77% of normal levels. As the market began to recognize the likely deficit entering the heating season, prices rallied in an effort to incentivize supply and/or ration demand.
Russian imports didn’t respond. Volumes to northwest Europe stayed flat at contracted volumes while flows to central/eastern Europe drifted lower.
Cue other sources of supply. Regional production peaked years ago, but the big producers are sending as much gas as they can into continental Europe.
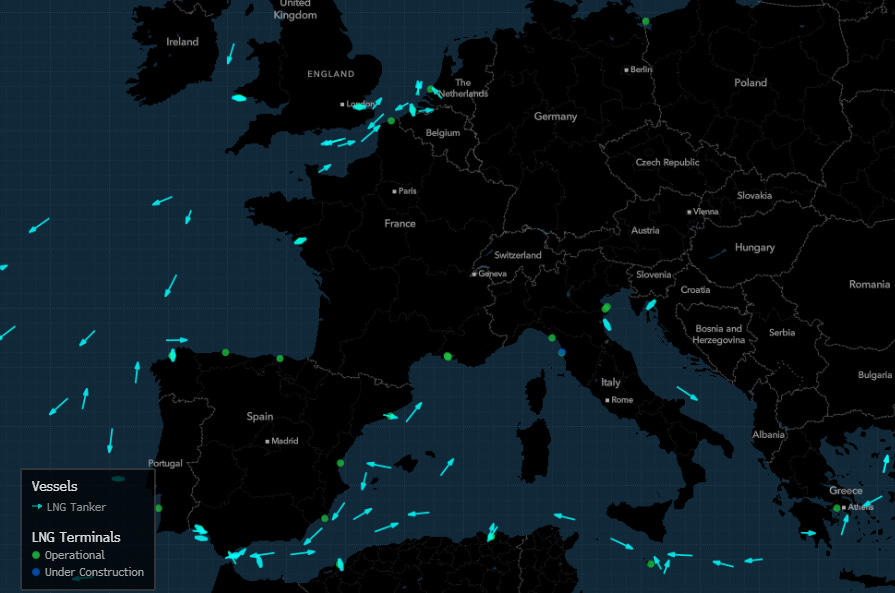
Answering the call from the European mega-price spike in December, an armada of LNG tankers from the US headed to Europe.
Soon LNG flows into northwest Europe broached all time highs.
The LNG armada backs up the unloading jetties in NWE, Long Beach-style.
With a resultant sharp impact on forward pricing. Per Bloomberg, March ‘22 LNG cargoes are being offered at a $2/MMBTU discount to futures, putting them nearly on top of April ‘22 forwards in the $23/MMBTU range.
To be sure $23/MMBTU represents a material premium to US realized prices, but is down near 60% since peaking just a month ago at $55/MMBTU.
The newest wild card for Europe gas price, apart from regular weather, is implications on Russian supply vis a vis actions in Ukraine. We make no call on the likelihood of a significant geopolitical event, but we do flag that a risk to our expectation of normalizing European inventories and price comes from Russian supply disruption in the wake of sanctions/military action/whatever geopolitical if the Ukraine situation deteriorates further.
Europe is still heavily dependent on Russian gas transported through Ukraine, although not nearly at the exposure it had in the past. Still, for a region short natural gas, any disruption is a material disruption.
We’ll tie it all in a bow here at the bottom, but for now take note of this thesis: European natural gas price matters for energy equities because it was the spark that lit the energy crisis narrative.
Corollary: if European gas prices normalize (down), then they will pressure other forms of hydrocarbon energy in kind.
En route to the conclusion, we pivot briefly to US natural gas market observations. We’ll spare you the buildup but keep the graphs regardless: there is no natural gas shortage/crisis/panic in the US.
Total US nat gas inventories are spot on with 5 year average
Supply as of now has been curtailed in several regions due to adverse weather. Northeast gas is off about 2 Bcfd.
Production in the Permian is down about 1 Bcfd.
Haynesville down a bit from recent highs, but not the volume reduction seen elsewhere.
Imports from Canada are recovering after a series of dips.
LNG exports out of the US are running as hard as they can at max nameplate capacity.
US LNG exports are particularly important, as they’ve been a driver of material demand increase in the country. New project startups in 2022 should add roughly 2 Bcfd to US natural gas demand with the startups of Sabine Pass Train 6 (0.75 bcfd) and Calcasieu Pass Trains 1-18 (~0.1 bcfd each, 1.6 bcfd total).
Sabine Pass Train 6 introduced feedgas in December and looks now to have all trains at the facility running at full capacity.
Calcasieu Pass is a modularized facility consisting of 18 trains with capacity of ~0.1 bcfd each. Flow data suggest the first of the trains is up and running today after a lengthy startup period.
The combination of production curtailments and higher net exports has tightened the net supply picture by over 5 Bcfd since YE21. Supply increase of +2.5 Bcfd in the last few days suggests weather-induced curtailments are easing.
We believe US production is likely to remain curtailed over the next week or so due to continued cold weather.
Although we look for production to begin recovering by late Jan as normal/warmer weather moves in.
With maybe 3 weeks remaining before heating degree days (and natural gas demand for heating usage) begins its seasonal fall.
This week is effectively the bottom in average cold temps across the Lower 48. The days get warmer and longer from here. Note the below-normal temps pervasive across the US in recent days have led to above-normal heating demand in residential/commercial settings.
In the meantime, drilling activity in gas basins continues to rise. We expect net natural gas supply to approach ATH by YE22
Gas basin rig count
This jives with what JPM is showing, even within the context of upstream capital restraint. Rigs are ramping. More rigs = more wells = more production. Below is JPM chart of rig count recovery in this cycle vs priors. Producers are adding gas rigs at a faster pace than prior cycles.
Normalized rig recovery cadence
Summarizing the natural gas state of the union:
Asia gas picture is looking looser. The region has adequate supplies thanks to warm weather and is sending extra volumes to Europe
Before the arrival of excess LNG cargoes from North America and Asia, NWE nat gas situation was looking very tight. LNG receipts are gradually reducing right tail risk. Russia supplies counted out for now, but wildcard is further constraint if Ukraine situation worsens. Best case for increased Russian volumes comes in 2H22 if the geopolitical situation doesn’t materially deteriorate before then - the need to restock inventories in the 2022 shoulder seasons will prevent a collapse in regional price
US natural gas supply/demand is a bit offsides right now (slightly bullish) after a cold snap in major producing regions. Look for normalization by month end as supplies set to grow throughout 2022 on increased activity in the field. LNG ramp throughout ‘22 will be offset by increased net supply. US nat gas balances today are the tightest they’ll be for the rest of the year.
Conclusion: Apart from a late season freak winter storm (not without precedent), the global gas picture loosens from February onwards unless the expletive hits the fan in Ukraine
Why does it matter?
Because it all started with the European gas spike last fall. When European gas prices spiked as the market began to anticipate a supply deficit heading into winter, hydrocarbons everywhere rallied.
Taking a step back, recall that in order to convert crude oil into refined products, refineries use a tremendous amount of natural gas both as a form of energy and as a feedstock for processes.
Depending on facility complexity, refineries consume 0.1-0.4 MMBTU per barrel of throughput.
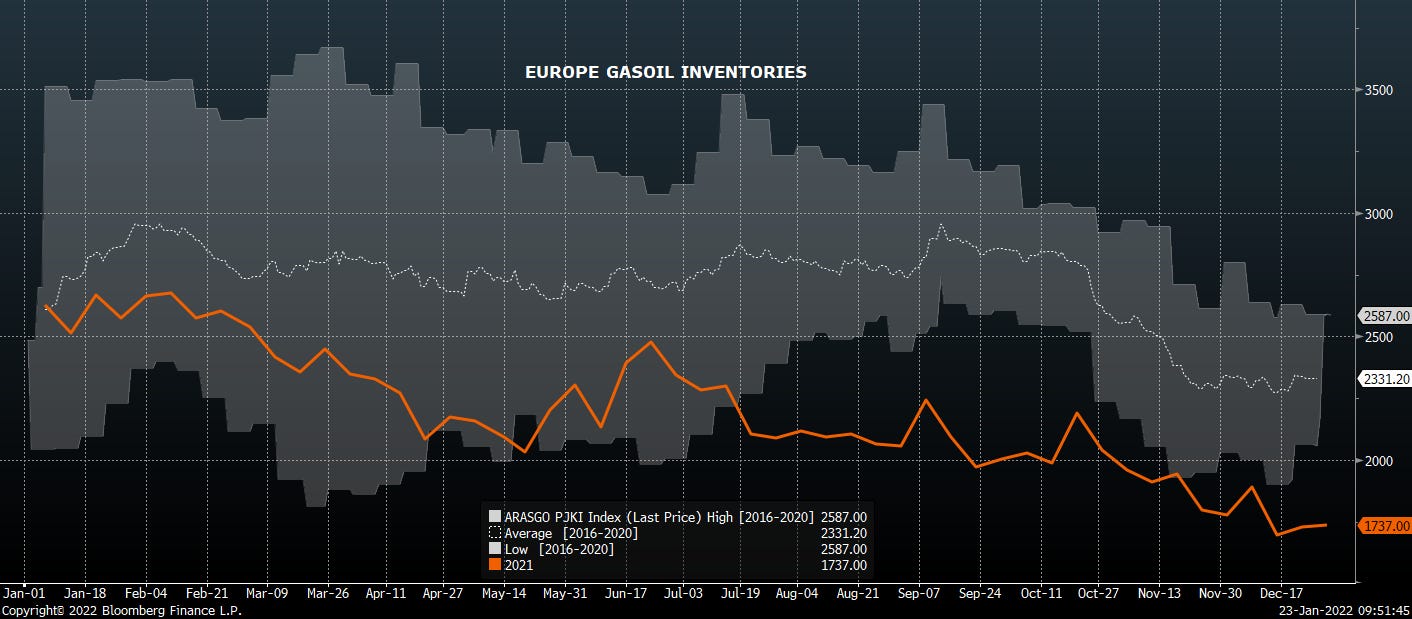
At the time that the European gas situation started to turn into a shortage, global refined product inventories were already looking tight. Gasoil stocks in Europe were below the 5yr low end when European gas prices began to take off in September.
The same was true in Singapore for middle distillates in the Asian hub.
There has been a steady bid for refined products, during a period of already low inventories globally.
Just as we did in natural gas, we focus analysis here on the impact of natural gas on the economics of refining in Europe and Asia. The former because it’s the marginal refiner thanks to aggregate low complexity and high cost; the latter because it is the center of product demand growth globally.
European refining
A low margin business for some time, European refining offers the ultimate operational leverage.
As European gas prices picked up in fall 2021, the refiners’ operating expense burden grew. Because global demand for product prices remained robust, the increased natural gas cost simply flowed through to the refined product sales price. Accordingly, the refiners’ gross margin, the difference between product price and feedstock cost, rose along with natural gas. We illustrate below looking at a single refined product (gasoil) for simplicity.
However, after adjusting for the enormous increase in operating cost associated with suddenly more expensive natural gas, we find the adjusted margin expansion much more subdued post-Europe gas rally.
A few European refiners are kind enough to post their own generic refining margins that track a similar phenomenon. Product price appreciation outpaced increased cost burden for a period, but the costs subsumed economics by 4Q21.
In short, even though headline gross margins appreciated when natural gas prices rallied, refining economics did not improve in kind. The growth in gross margins - and importantly REFINED PRODUCT PRICES - was a reflection of higher net cost passed along to the consumer. Change in net margins was flat to negative.
Asian refining
Asia based refining show a similar trajectory to Europe. As European natural gas prices rose, they pulled up Asian LNG price. Headline cracks rallied in the fall as the higher natural gas price was passed along to consumers.
But once again, after adjusting for higher operating costs because of stronger natural gas prices, we find the adjusted margin to again show a flat/negative trajectory.
A brief note here on the above methodology: refiners’ exposure to spot natural gas price fluctuations in Asia and Europe is lower than in the US thanks to longer duration and/or lagged price contracts. Thus, the worst of the negative margins in the charts above likely was not the realized margin thanks to the insulation the term/lagged contract structure provides. Asian/European refiners got hit, but were able to share the pain along the value chain.
What was the point of this entire digression into international refining?
To illustrate in chart form the following sequence of events:
Europe natural gas inventories ran low
European natural gas prices rallied and Asian LNG prices rallied in sympathy
Higher global natural gas prices flowed through to higher refined product prices
Underlying supply/demand dynamics for refined products were largely unchanged apart from seasonal demand for distillates as a heating fuel and a de mimimus amount used for power
Higher product prices were largely a factor of high natural gas prices
In a nutshell
Absent a military incursion-related supply shock in Ukraine/Russia, global gas balances are loosening.
If high gas prices resulted in higher product prices, the inverse should hold true as global gas balances loosen. Lower natural gas prices will depress refined product prices, which will in turn depress refining margins.
If the market depresses refining margins enough, the refiners will run less crude to mitigate operational losses - resulting in less crude purchased.
The generic, cost-advantaged US refiner is netting $5-10/bbl in gross margin before operating expenses of $3-8/bbl.
Compress the gross margin further and things could get ugly.
Of course, if the Ukraine situation goes south, all bets are off.
Viscosity Redux


