
DOEs: Takes & Hot Takes
DOEs: Takes & Hot Takes
Assuming there's a difference

Back after a couple days on the road. Some observations from today’s EIA inventory report as we get back in the saddle.
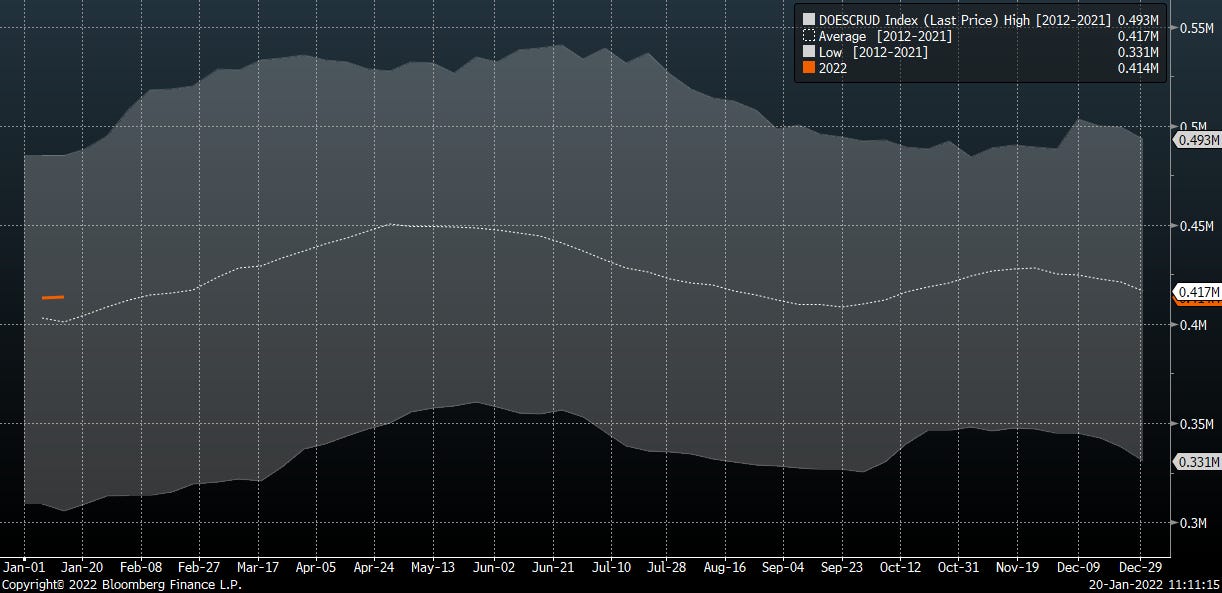
Crude inventories at low end of 5yr range; middle of the range for 10yr window. See the orange stubby line at lower left
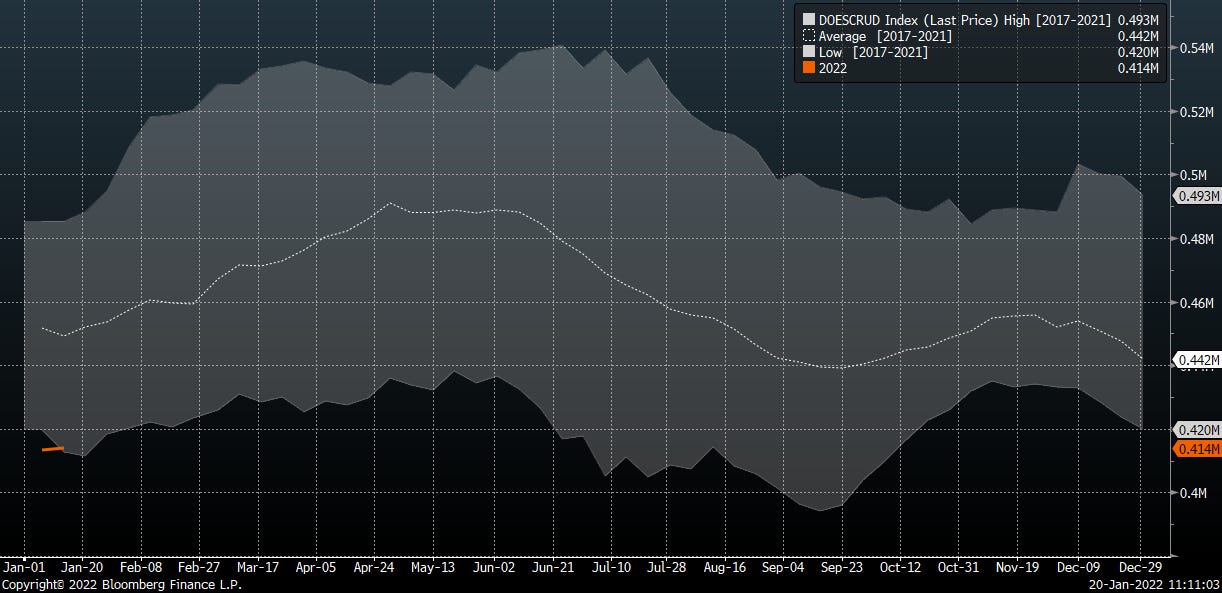
Current crude inventories vs 10 yr band.
Crude inventory days of cover
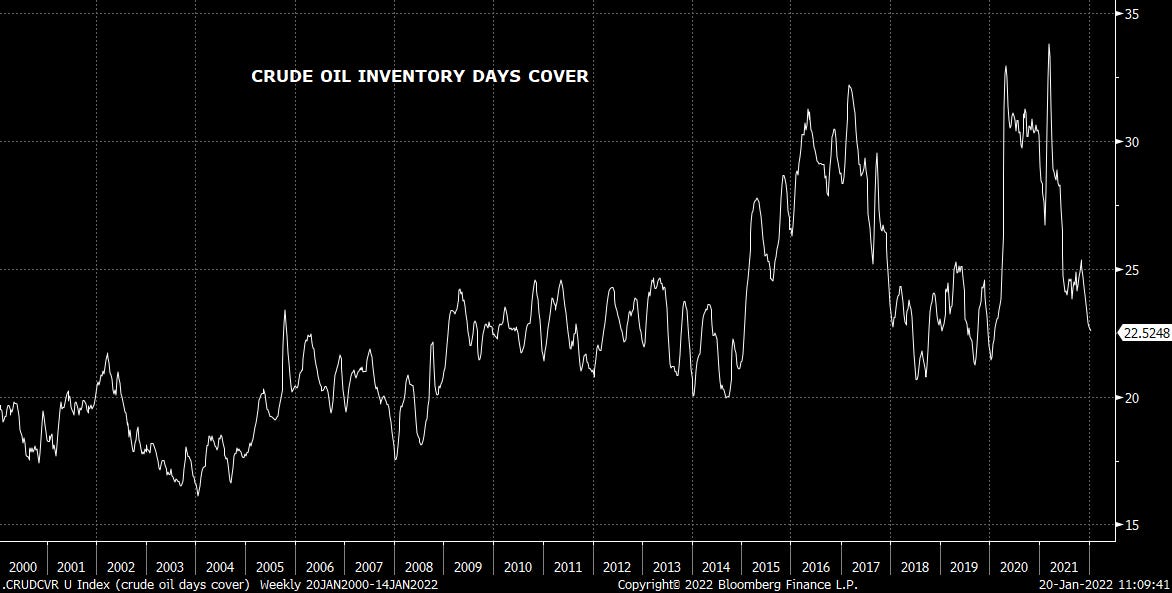
Crude days cover vs 10yr

At 15.5 mmbbld crude inputs, refiners are running a hair below the 5 yr average.
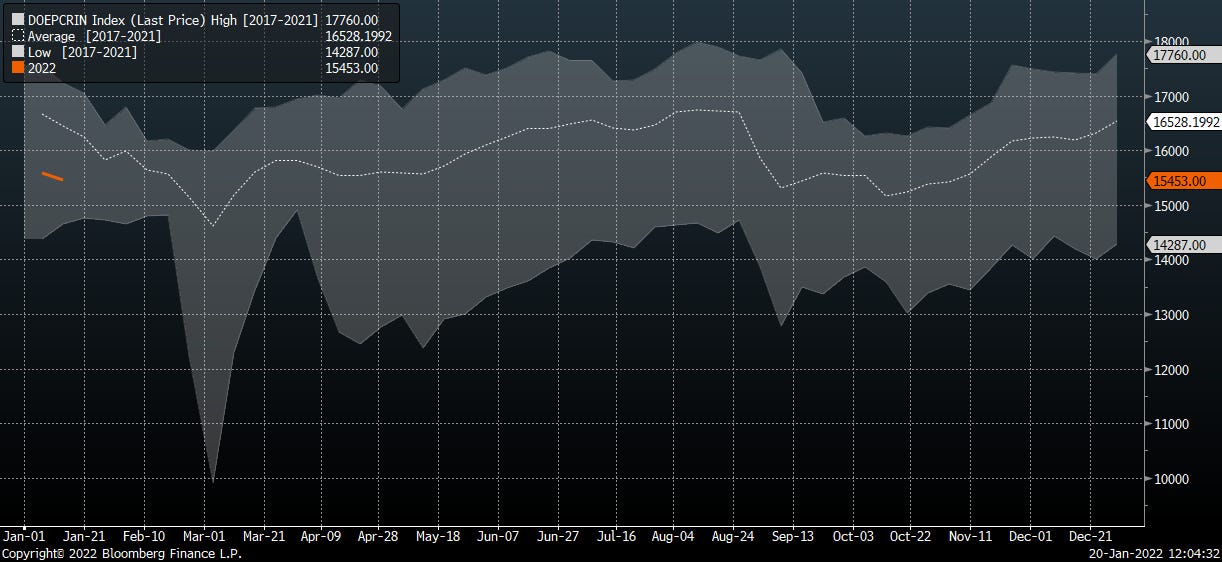
On a % available capacity, refinery utilization middle of the pack vs the 5yr

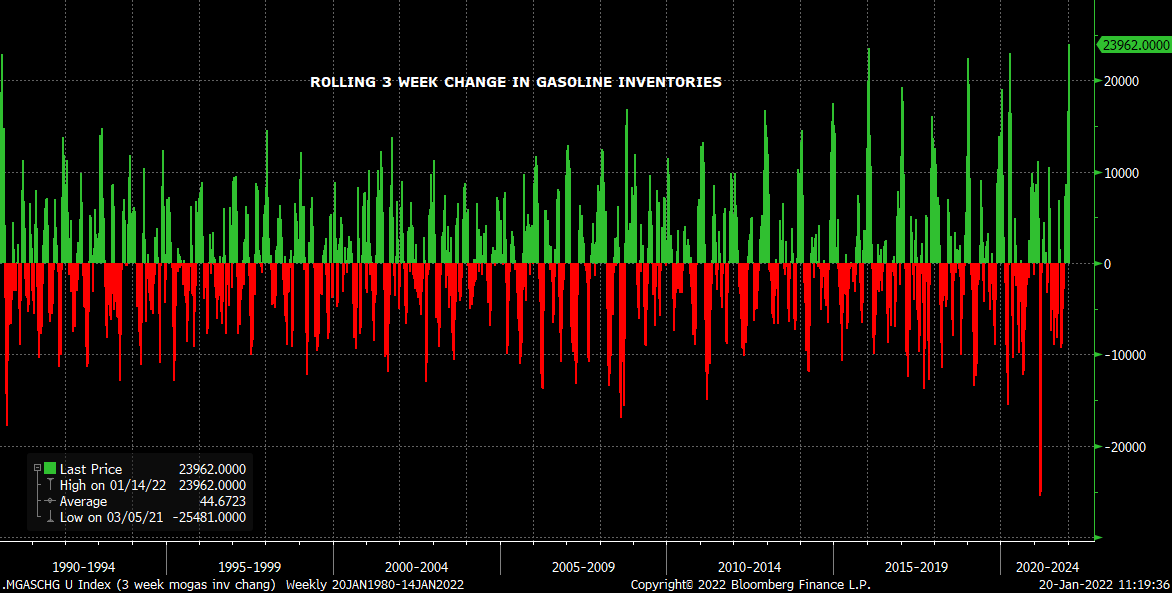
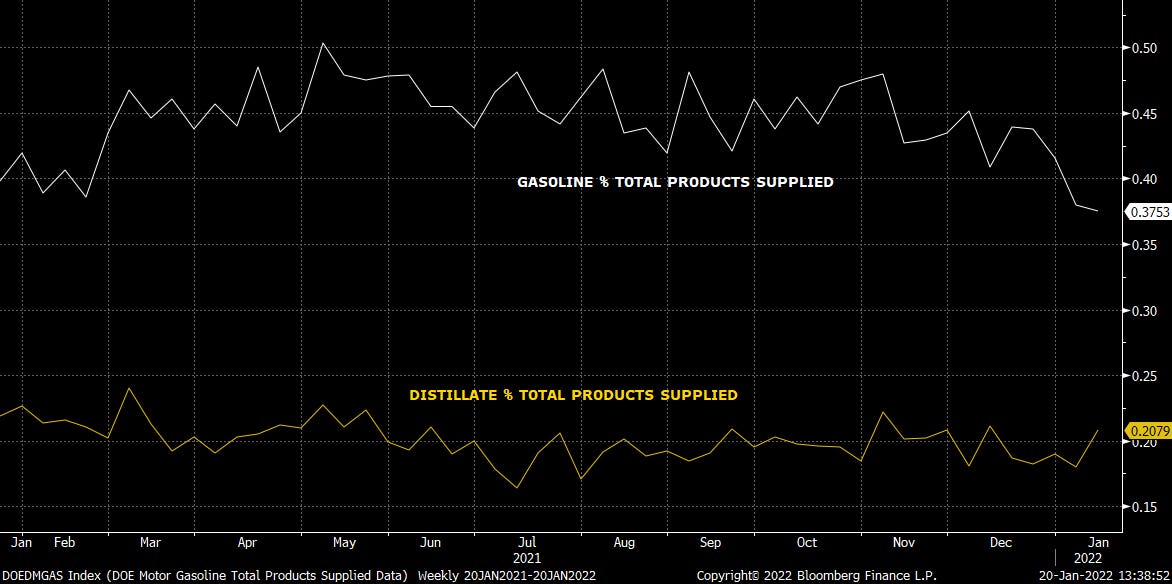
On to products. Gasoline continues the trend of big builds. Big builds.
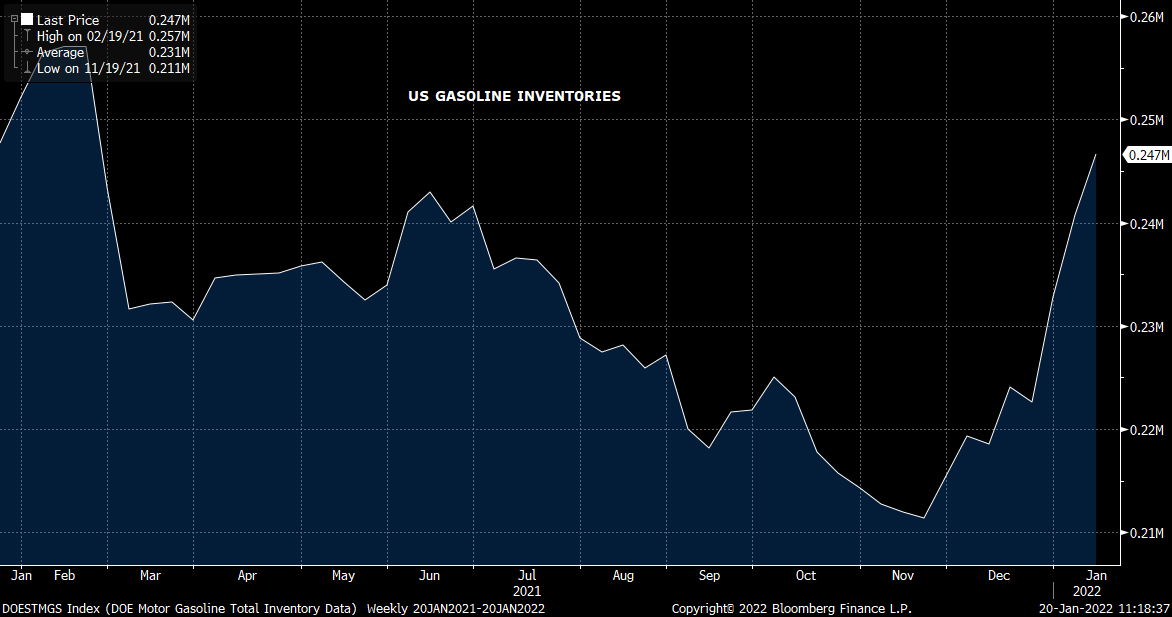
How big? 24mm bbl build over the last 3 weeks. It is the largest 3wk build since ever….
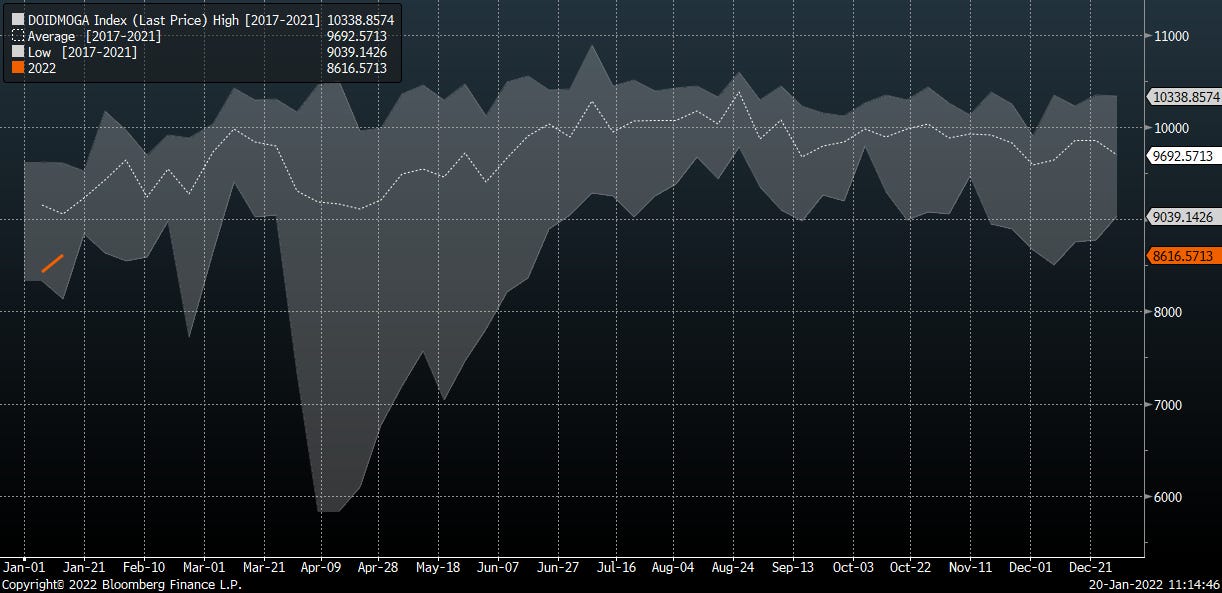
Aligns with demand. Gasoline demand today sits at the low end of the 5 year range
The story for crude markets has been distillate. Distillate inventories drew small, keeping inventories low.
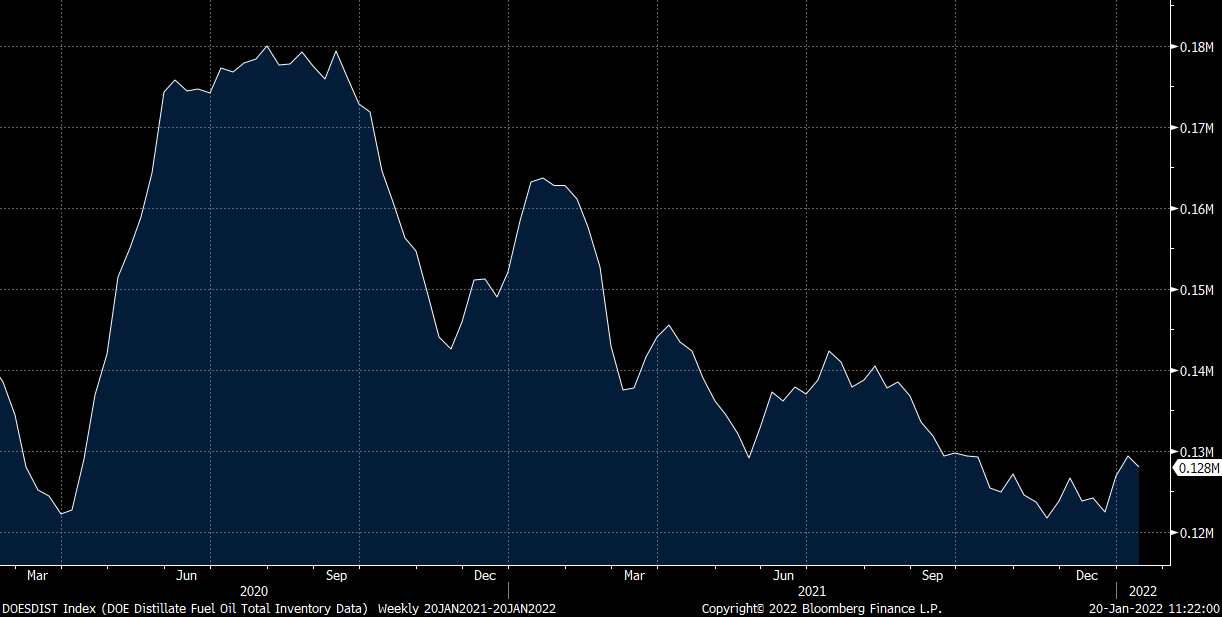
Below the low end of 5 yr inventory range
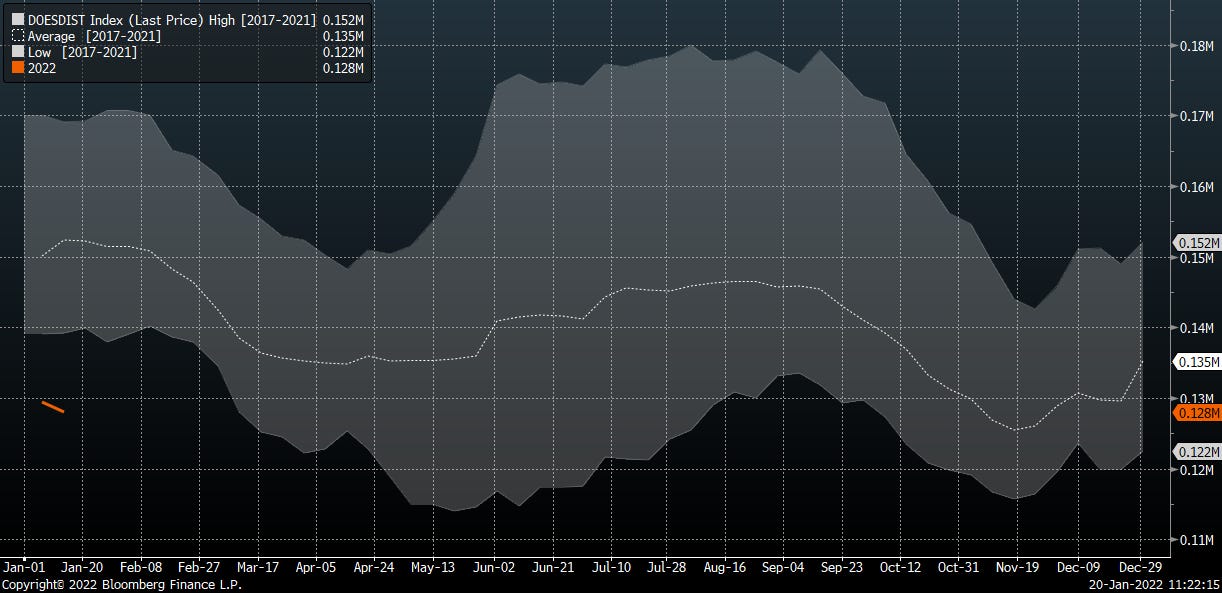
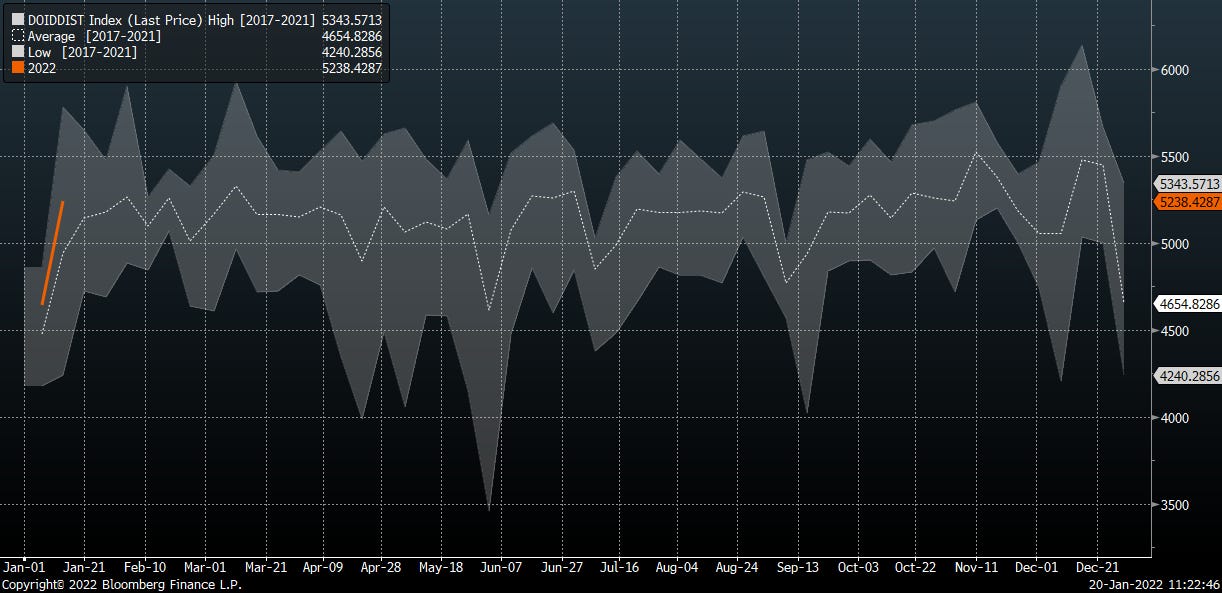
Though distillate demand is tracking pretty much in line with 5 yr average
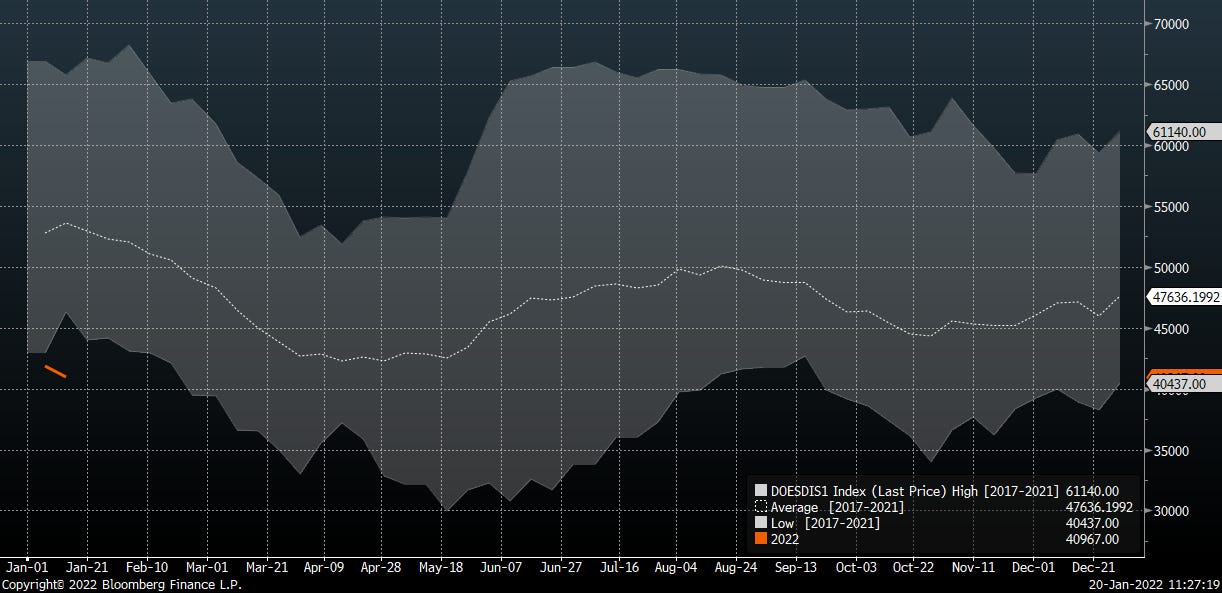
Digging further, regionally PADD I (white) and PADD III (green) are the regions to focus on based on sheer size.
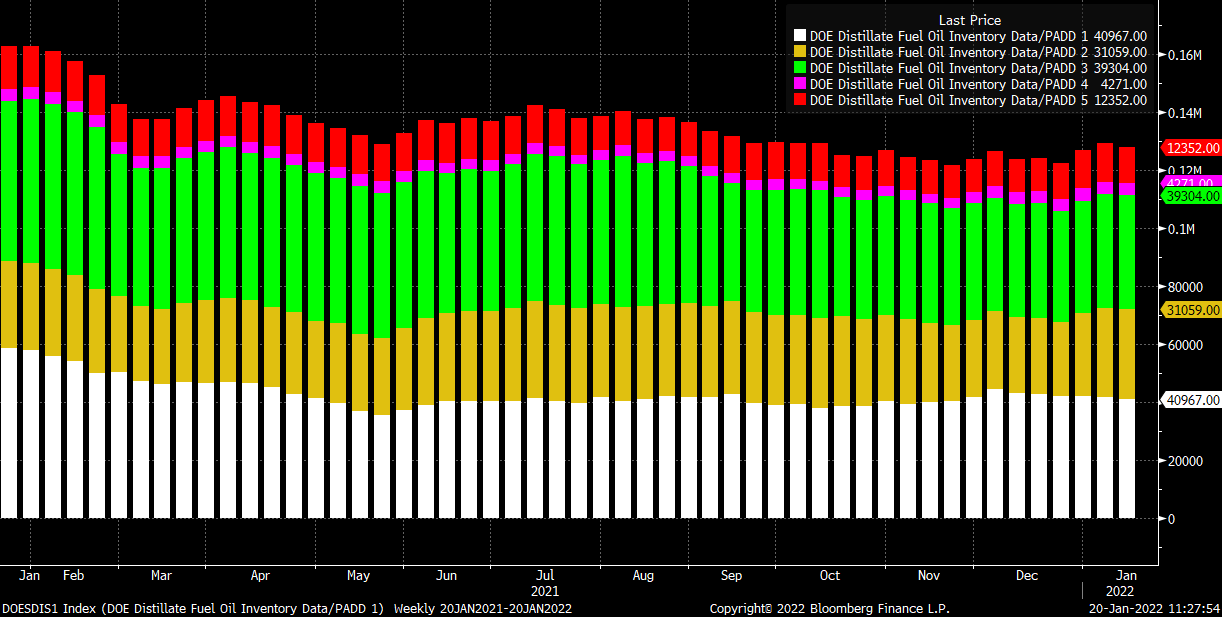
PADD I distillate inventories are running below low end of 5 year as cold weather moves in.
PADD III is low and the only thing we can attribute it to is lower than expected runs. Exports aren’t deviating massively.
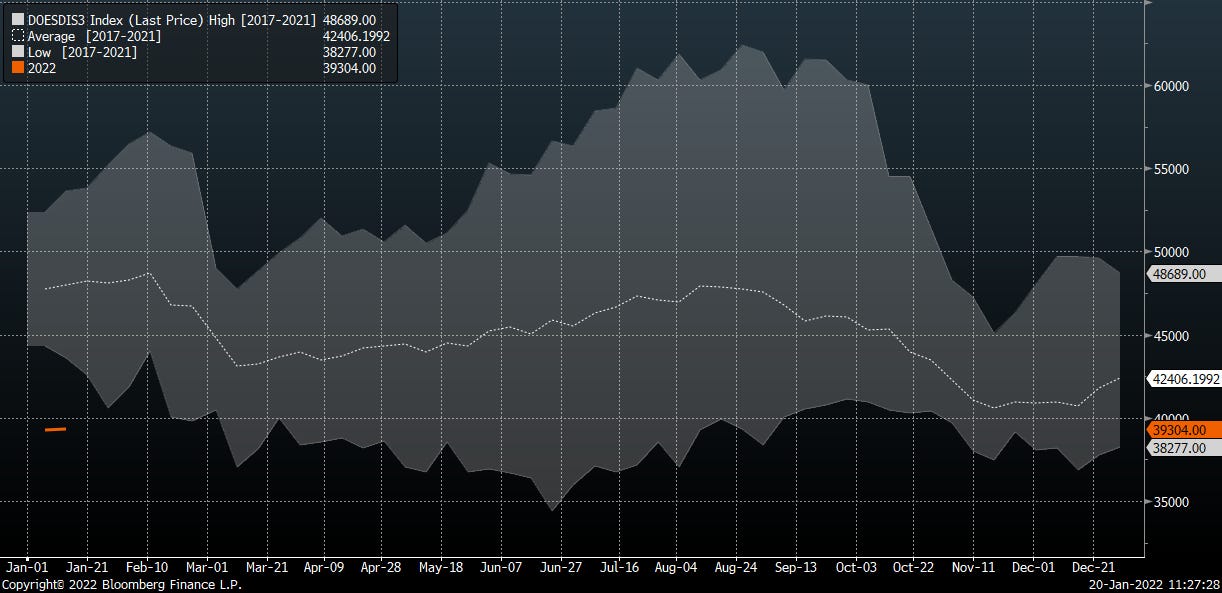
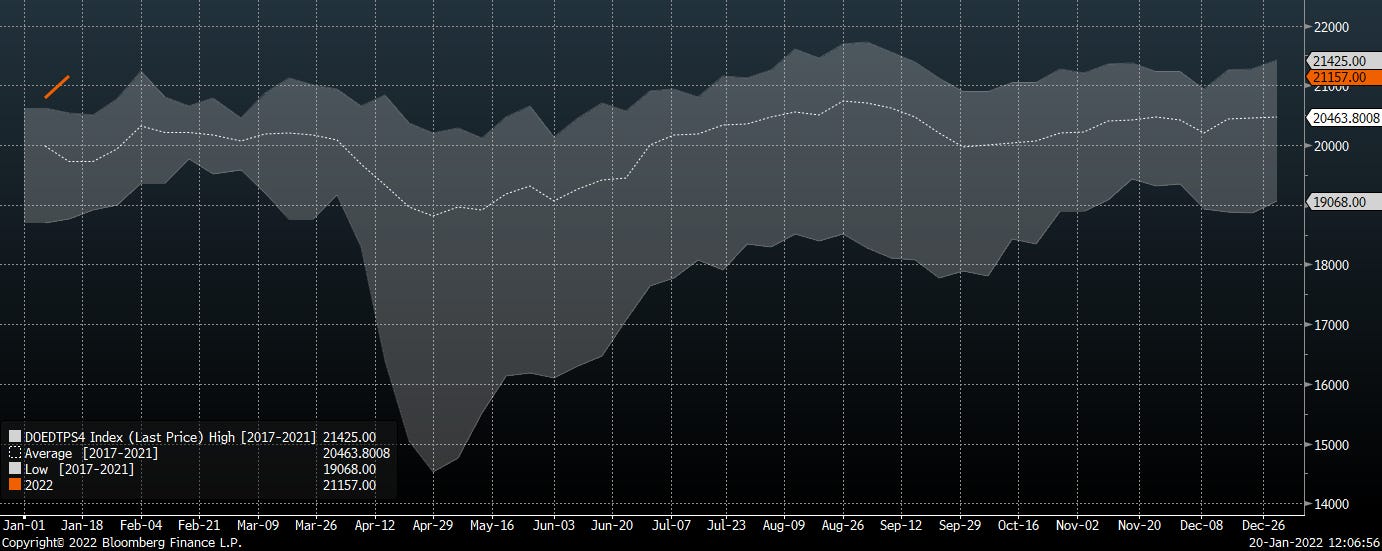
There are a couple hot takes out today that note the total product supplied (a proxy for total demand) is quite robust at >21 mmbbld.

Without context, that total product supplied number is well above the 5 yr window. Which should be a head-scratcher since we saw above that the largest single product consumed in the US, gasoline, is running below normal demand.
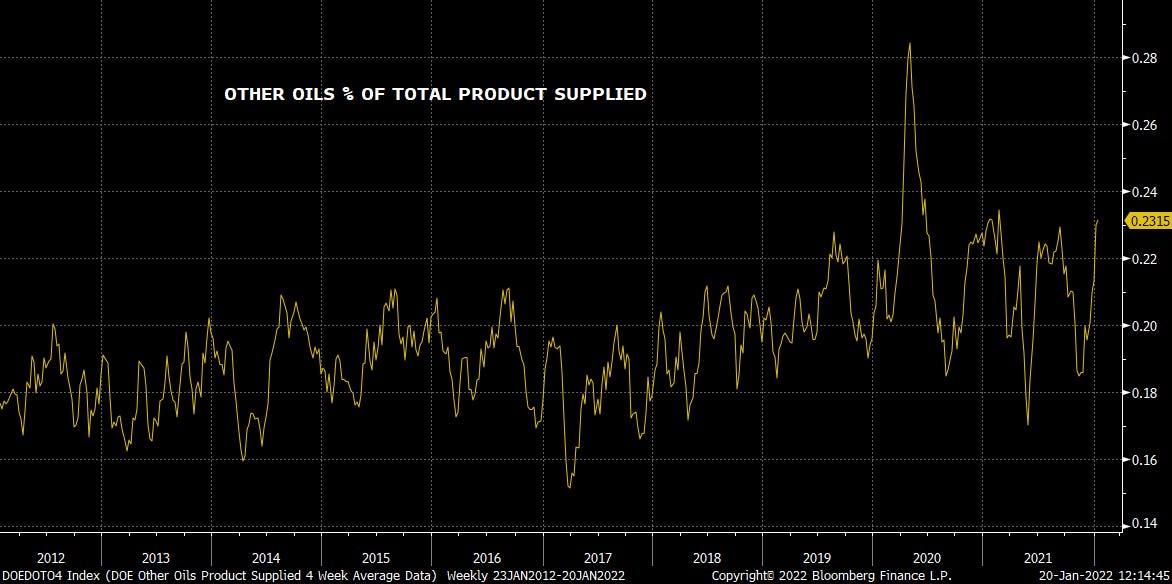
What some of the hot takes overlook is the nuance that Total Products Supplied also includes “other oils.” This is important because it includes NGLs. And consumption of NGLs is definitely hot, but also NOT a proxy for crude demand
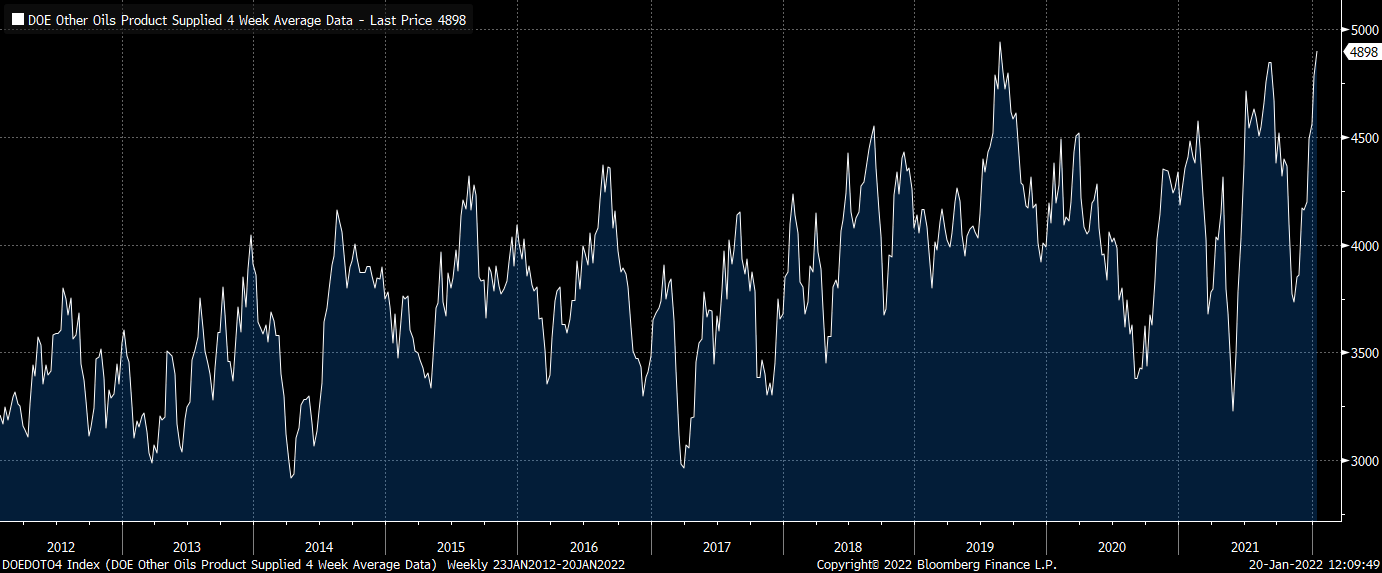
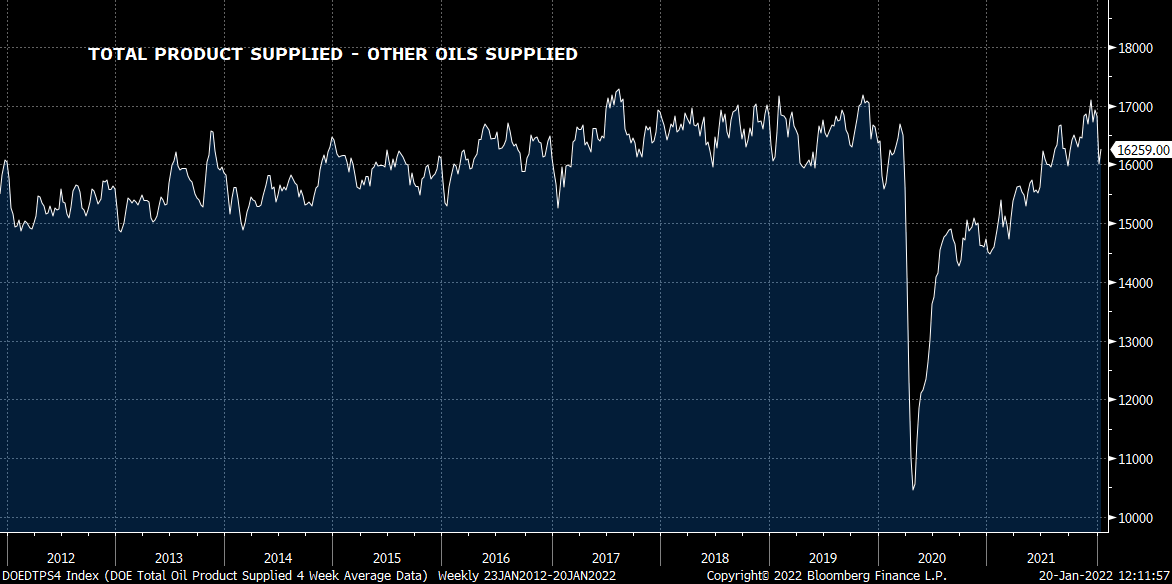
Netting out other oils from total product supplied we get a more reasonable picture of native crude demand. This looks/feels more realistic and makes sense because demand for petchem feedstock (“other oils”) grows at 5x the clip that black oil for refinery demand does. 16 mmbbld today at low end of 5 year range
The Other Oils category is at 23% of total products supplied, up from <20% a few years ago. On a base of >21 mmbbld, these % points start to matter. Petchem is the future, black oil - less so
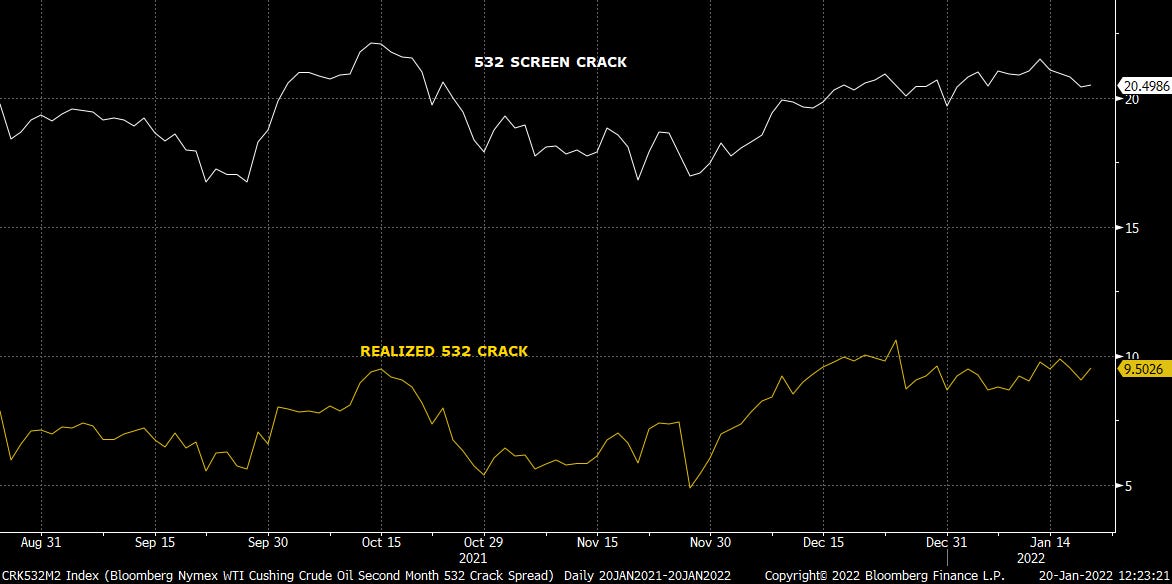
Finally, we invariably see a few hot takes on $20/bbl 532 screen cracks showing some of the best seasonal strength in a long long time. True, using screen price only.

Of course, screen cracks are up in no small part thanks to huge cost flow through which refiners are bearing. That $20/bbl screen crack drop to a realized crack of sub $10/bbl when netting out the big cost burdens refiners are eating.
As we’ve flagged, the crude market isn’t tight. At least not the way the broader market thinks. The distillate market, however, is tight. But - the tightness has been created/exacerbated by a number of idiosyncratic one-off events which are in the process of being unwound. We continue to look towards late 1Q for weakening distillates to weigh on the overall complex.
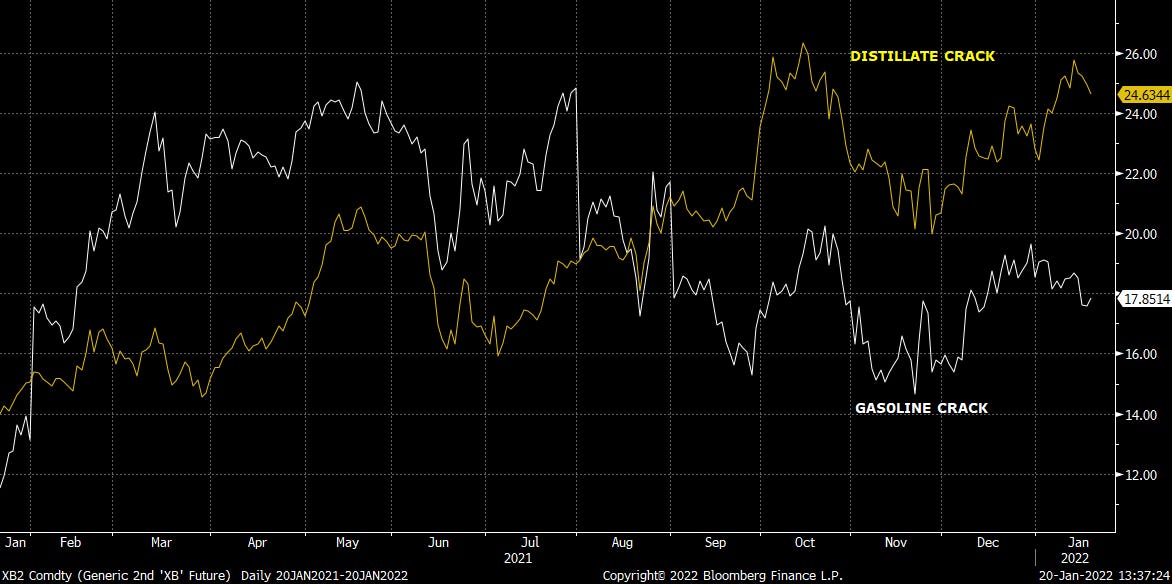
As we see it, the US refining complex is at best breakeven today on its gasoline production and is dependent on the smaller distillate pool to keep the lights on.
When distillate strength fades, the downstream complex earnings will be pressured. Remember, take ~$12/bbl off the numbers below to get to realized margin. Then deduct opex and transport to get to net margin. Gets skinny

VR
viscosityredux@gmail.com