
Beware the Ides of March
Beware the Ides of March
Because it's more fun to say it in January

Here’s an interesting stat from today’s DOE inventory report: at 18.1 mmbbl, the two week change in US gasoline inventories is the largest since 2016 and the second largest of all time. In other words, gasoline supply exceeded demand in the last two weeks even more than it did during the COVID shutdowns.
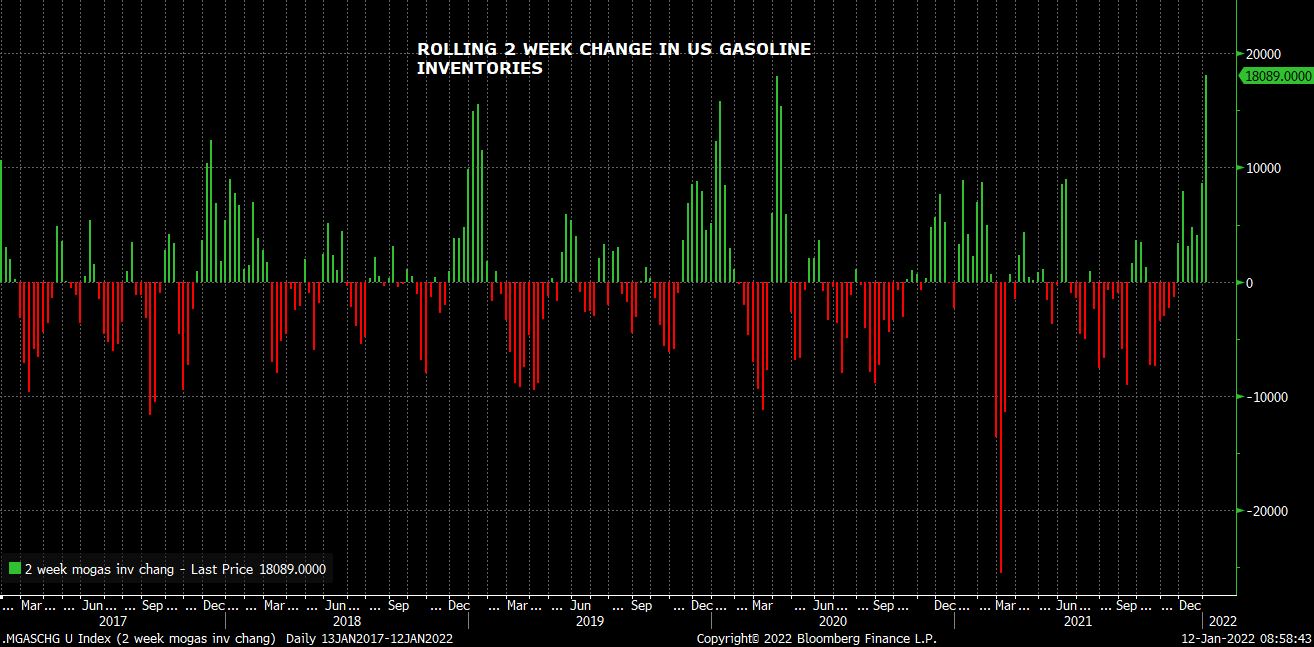
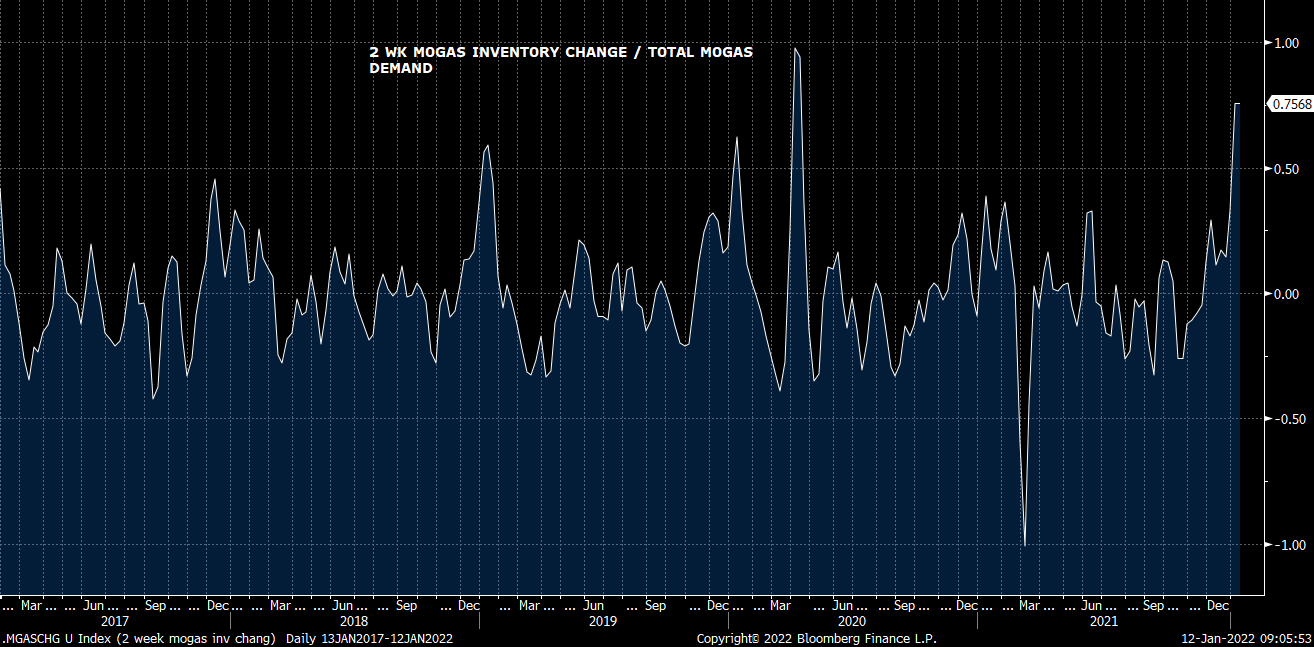
Relative to implied demand, the reported two week build in mogas amounted to 75% of total two week demand. In October, inventories drew the equivalent of 25% of total demand.
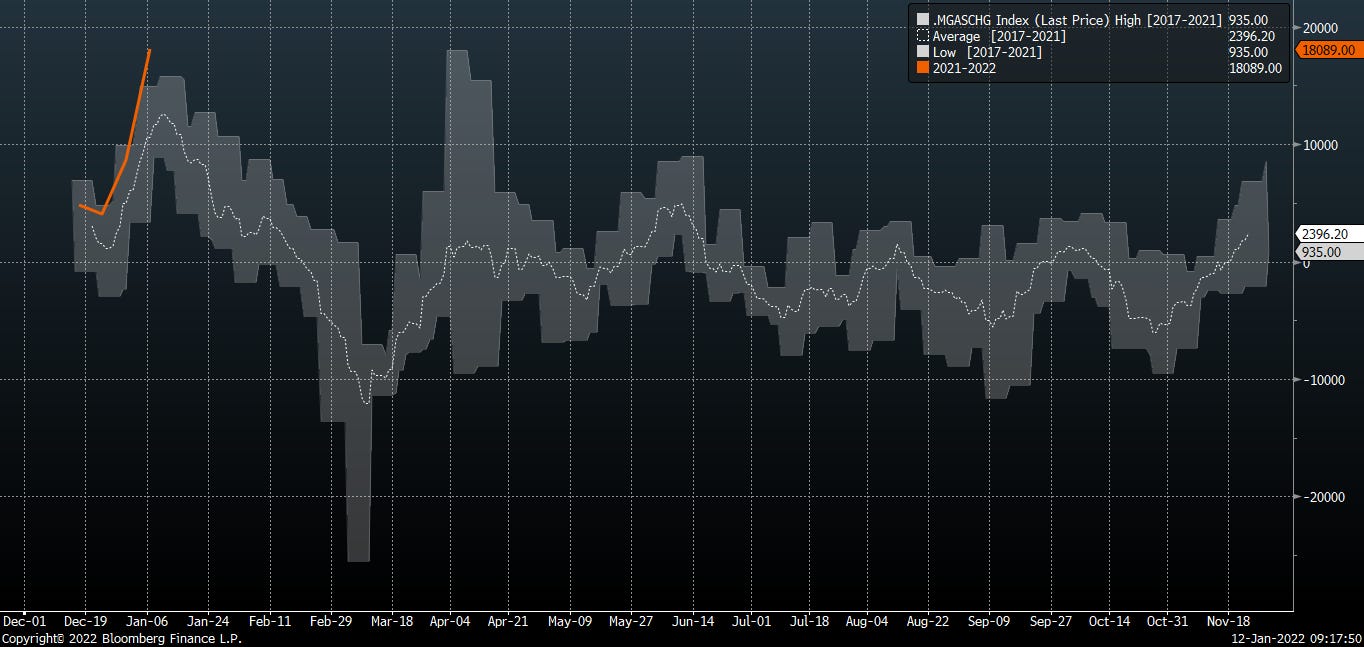
A market outlier vs 10 year seasonal trends.
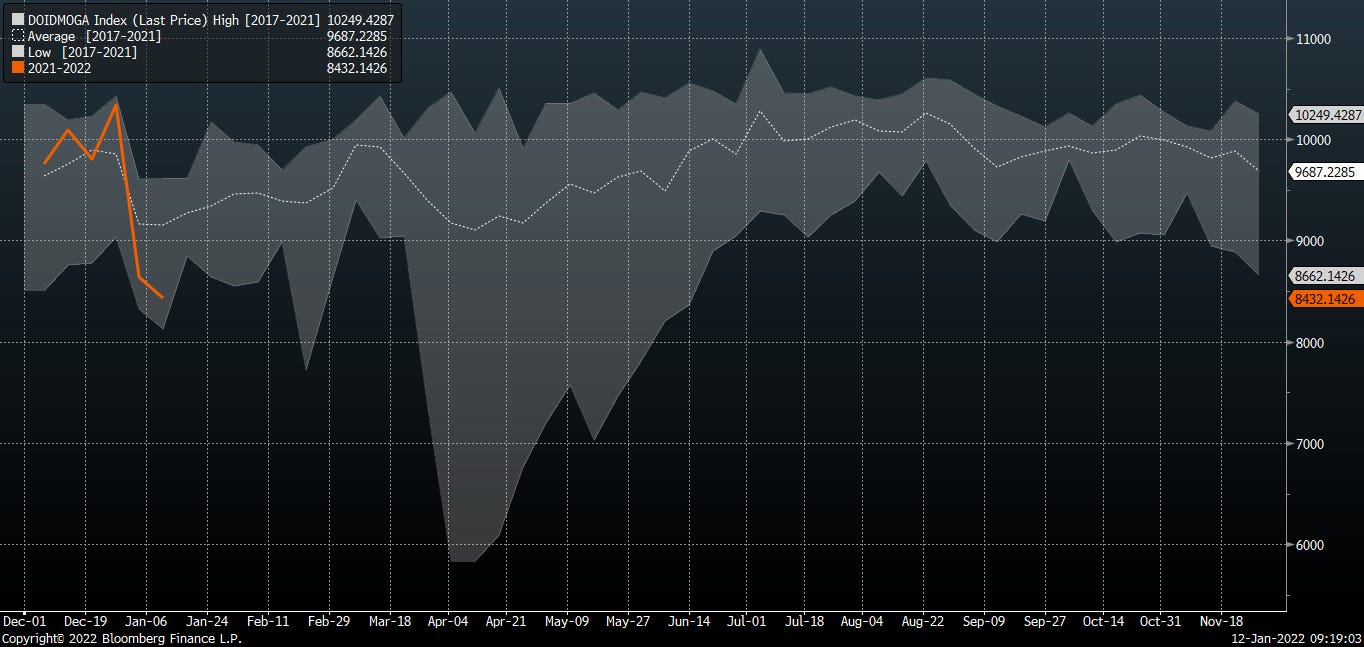
Though demand certainly running below seasonal norms.
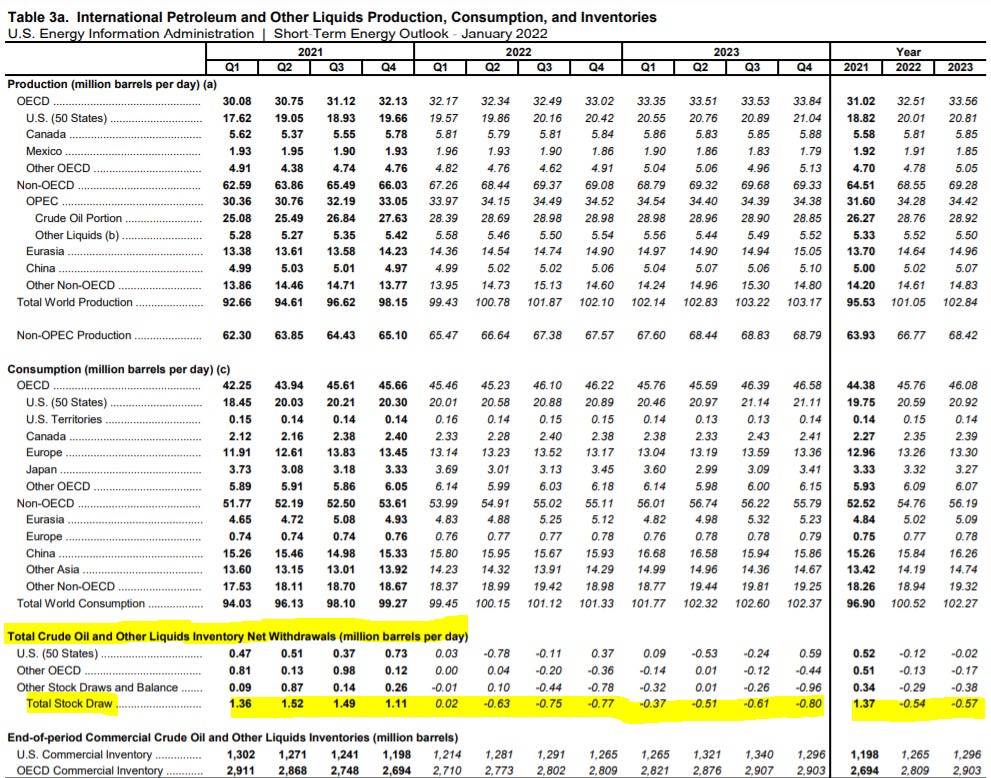
EIA Short Term Energy Outlook
Yesterday, on release of EIA’s STEO, the commentariat were quick to flag this nugget from the report:
“EIA shows global oil demand at 101.1mmbbld, global oil supply at 98.3 mmbbld in December 2021.”
This is a great case study in investing on the foundation of backwards looking data. Investments are supposed to be forward looking, of course.
What do the EIA data say elsewhere? It’s a pretty good read - we encourage a skim through Consequential inventory draws throughout 2021. Flat inventories in 1Q22. And then, as far as the eye can see, inventory builds. 2Q-4Q22, 2023.
What is the proper risk allocation to a group producing a commodity forecast by every bank and agency to be on the precipice of prolonged oversupply?
It is our contention that the strength in Energy of late is attributable largely to the following:
10Y rate increases
Manic inflation protection chase
Supply/demand narrative run straight off the rails
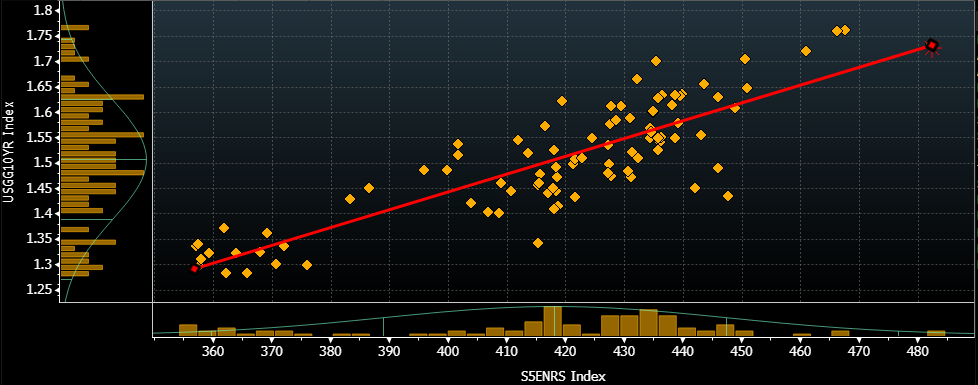
Strong relationship between 10Y and Energy index over the last 6 months. Rates have gone up, as has Energy.
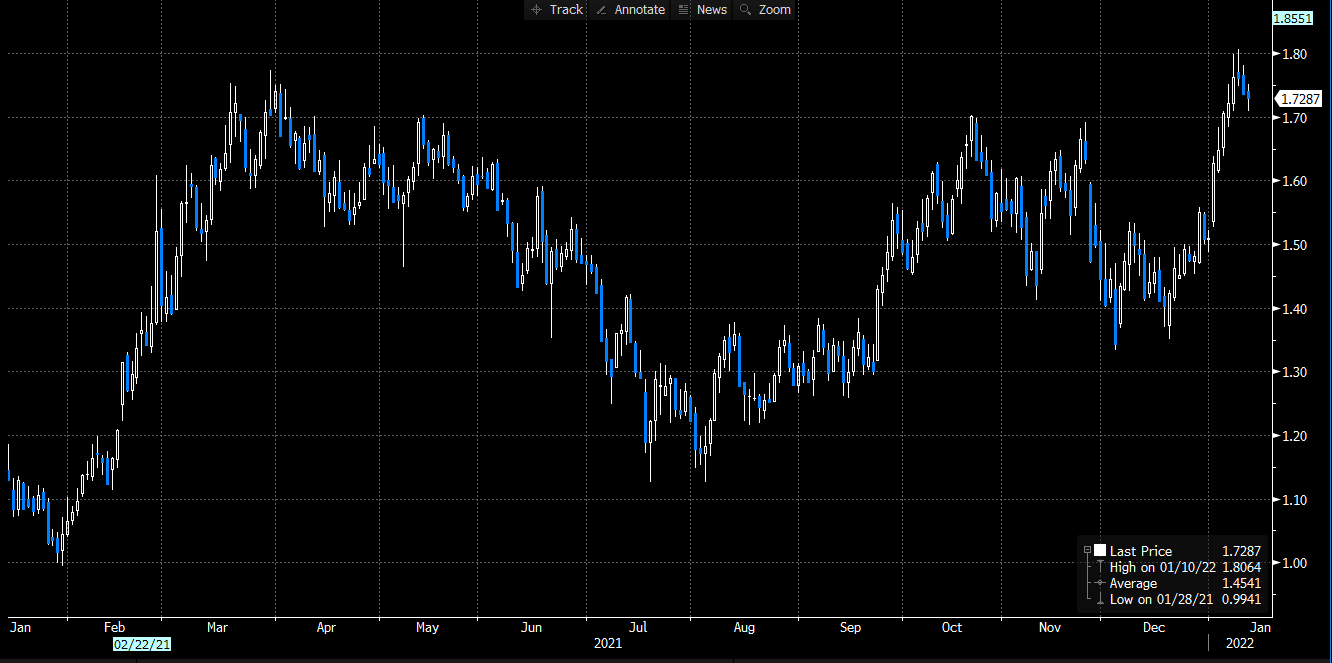
But for the short term at least, we watch the trend in the 10Y yield. Either December’s CPI print or the one we see in a month for January will mark the high print for the cycle. 10Y yield mulling the same the last few days.
Inflation hasn’t been a factor in the investment process for well over a decade. There’s been a lot of turnover in markets during that intervening decade or so.
We maintain that few humans or algos trading today have a firm grasp on the implications of today’s inflation spike. They go to the old playbook - which the more industrious sellside shops are happy to pass along.
“When was the last time inflation was a big deal?”
“That’s easy. The 1970s.”
“Perfect. What asset classes worked well then? In the 1970s… 50yrs ago?”
“We have a chart right here for you.”
“Should I ask if the two episodes are comparable?”
”Great chatting with you.”
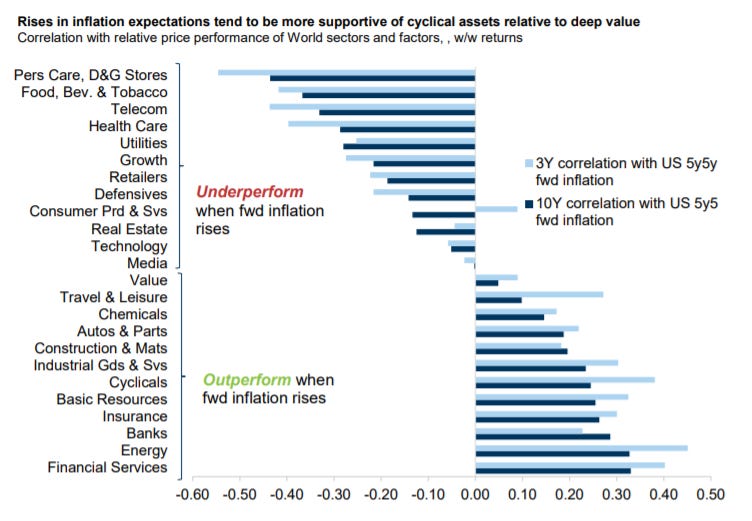
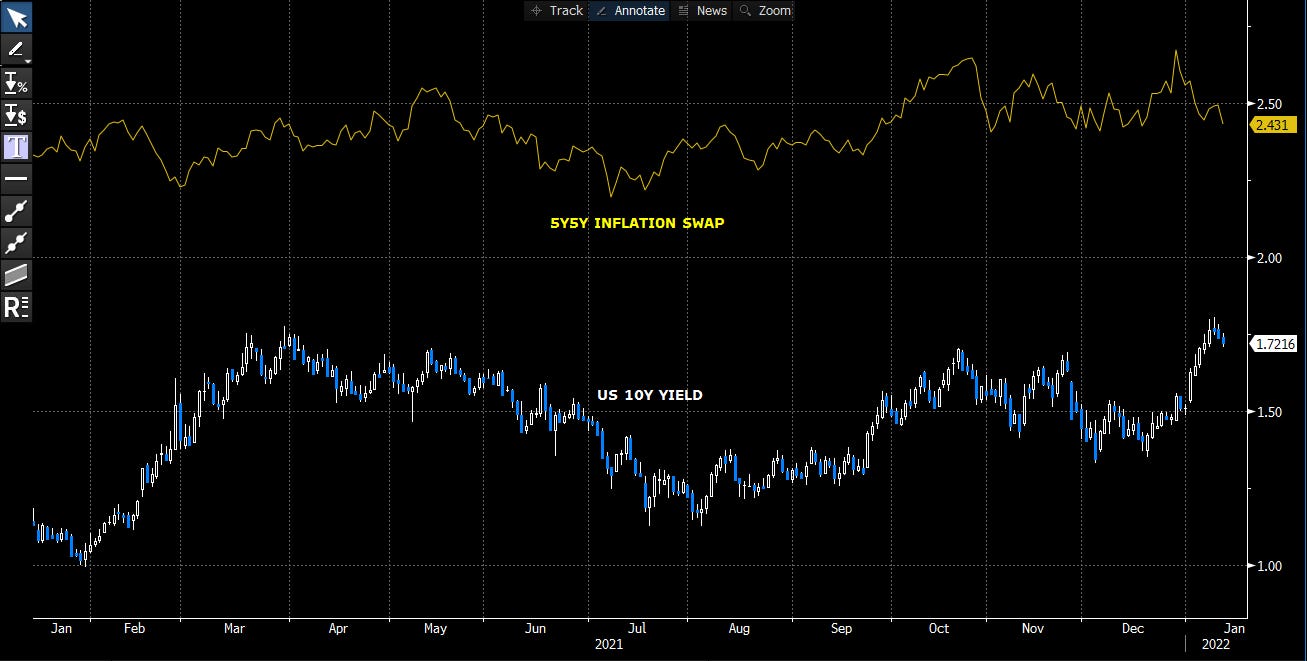
Referencing the graph above, we’re told there is a strong correlation with 5y5y inflation swaps (5 year expected inflation rates starting 5 years from today).
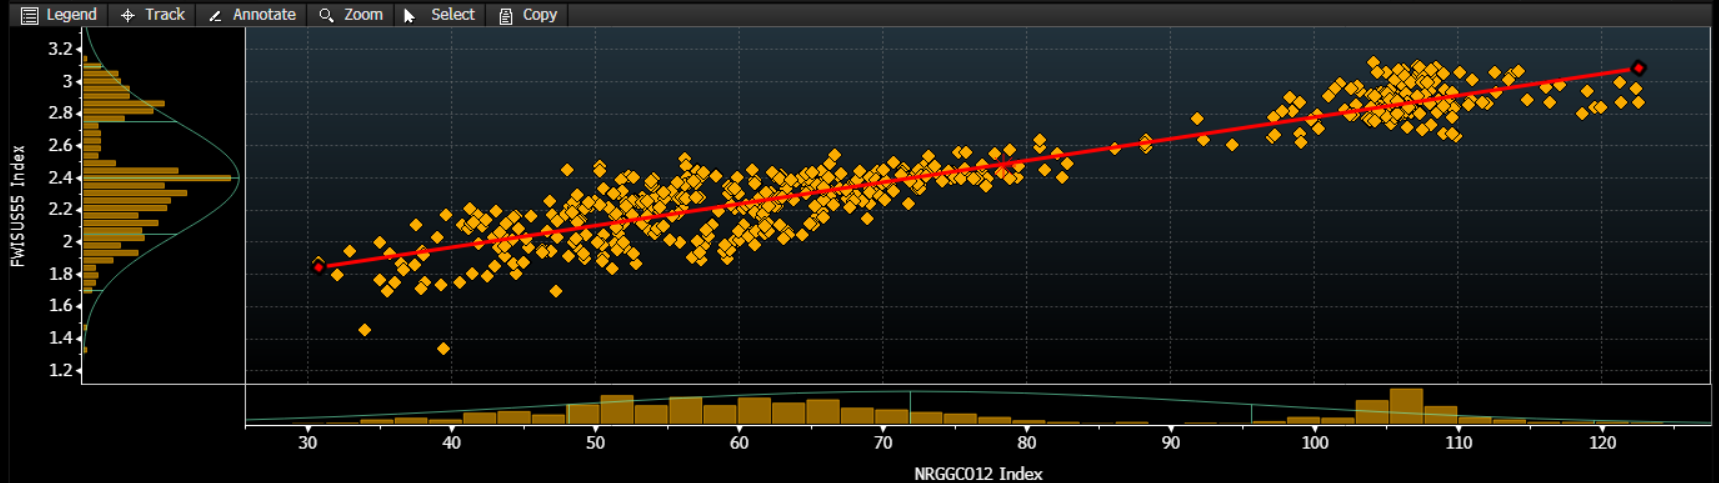
And indeed there is a correlation between 5y5y and Brent 12 mo strip
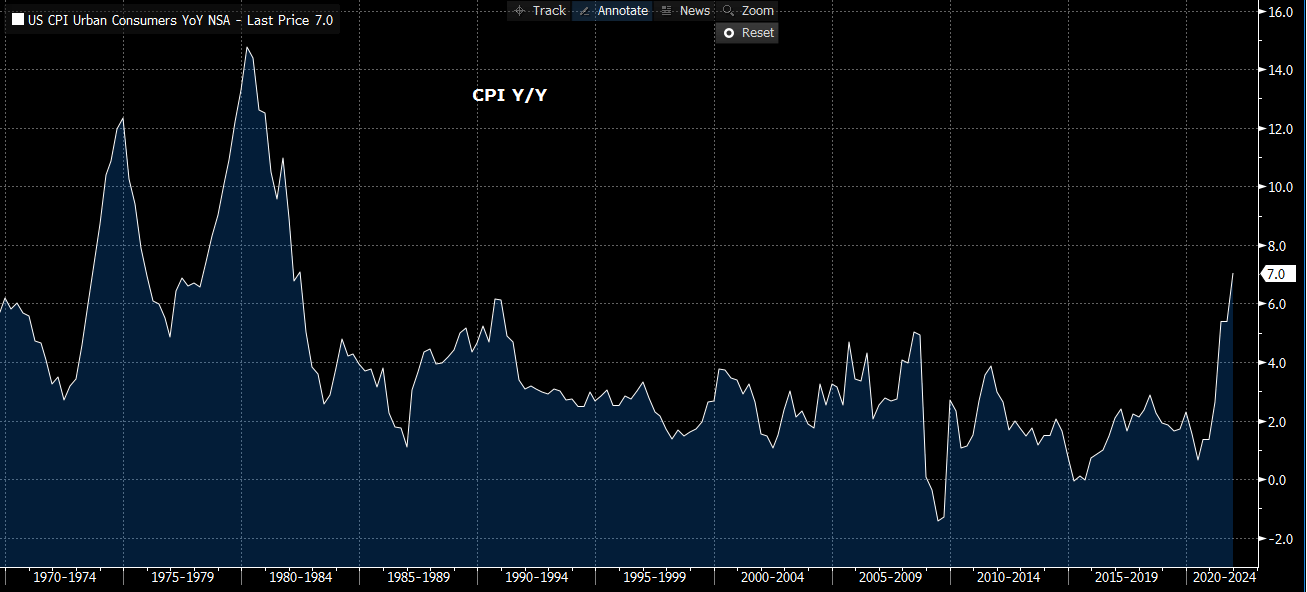
But here’s the thing. Inflation is a mathematical derivation. The relationship between PCE and 5y5y seems directionally OK, but without a doubt the 5y5y measure is looking past the current inflation readings.
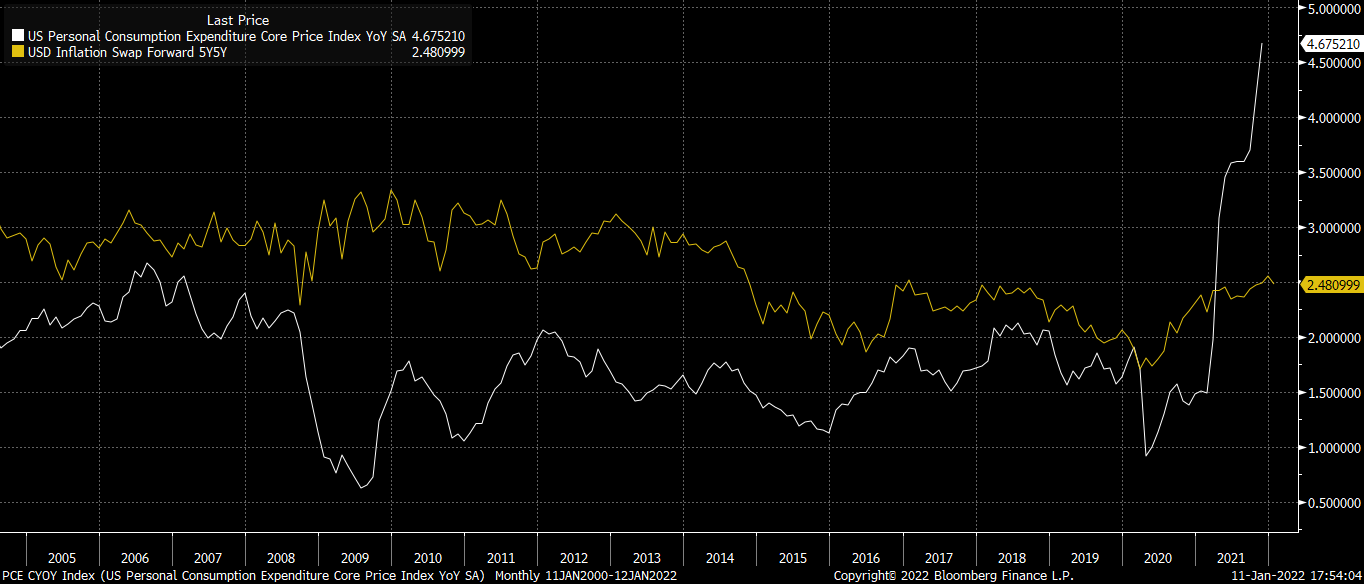
Which are going to peak. Because that’s how math works.
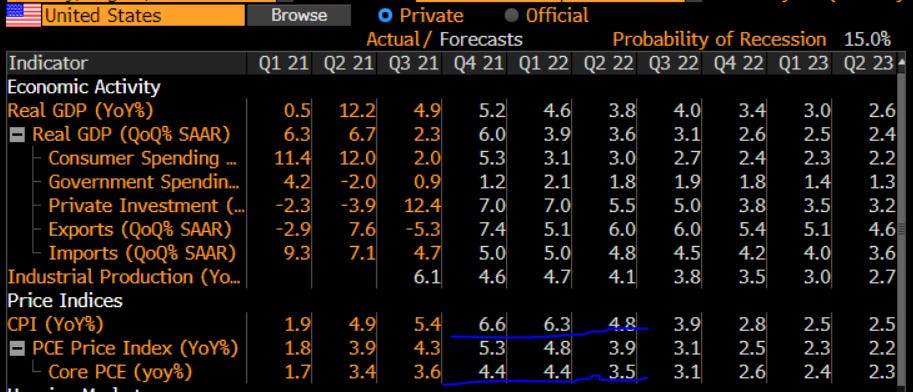
US CPI/PCE outlook
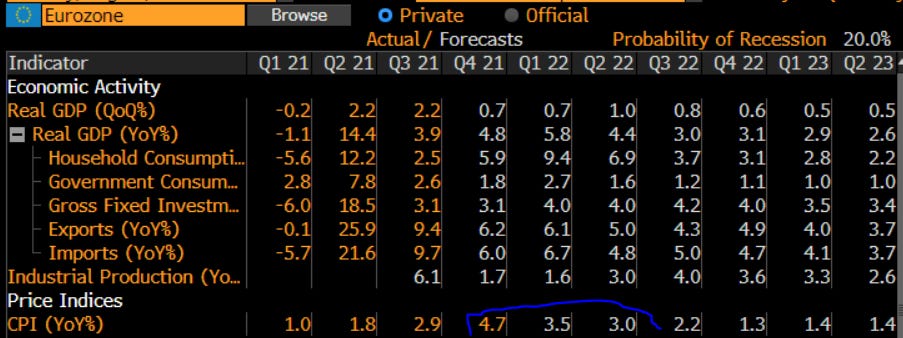
Eurozone CPI
BRICs
If our assumptions are correct, market participants have been buying cyclicals with high inflation correlation, such as Energy, right into the peak inflation print of the cycle.
Then what?
We add 5y5y inflation swap to our earlier chart of 10Y yields for reference.
On the crude narrative, we are in that stage wherein price appreciation begets narrative rationalization, which begets price appreciation.
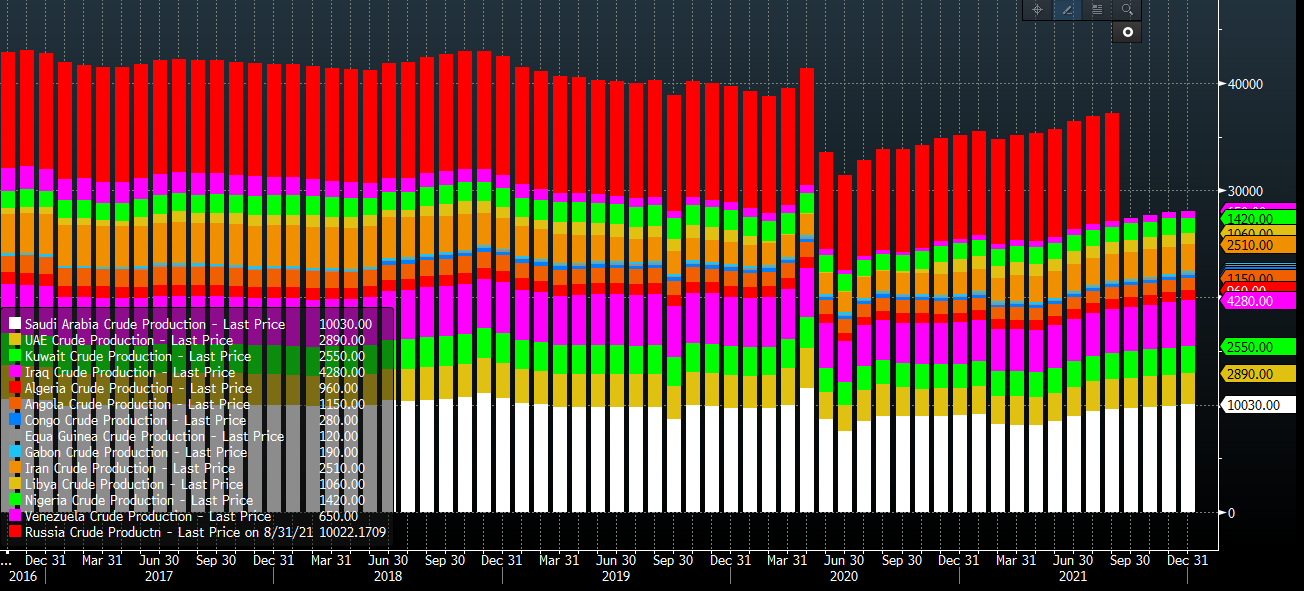
Particularly amusing are the hyperbolic statements addressing the imminent (past tense even?) demise of OPEC+ spare capacity. Perhaps, but as we’ve pointed out, the group has produced a lot more crude oil in very recent memory (apologies, Russia data available only through Aug ‘21).
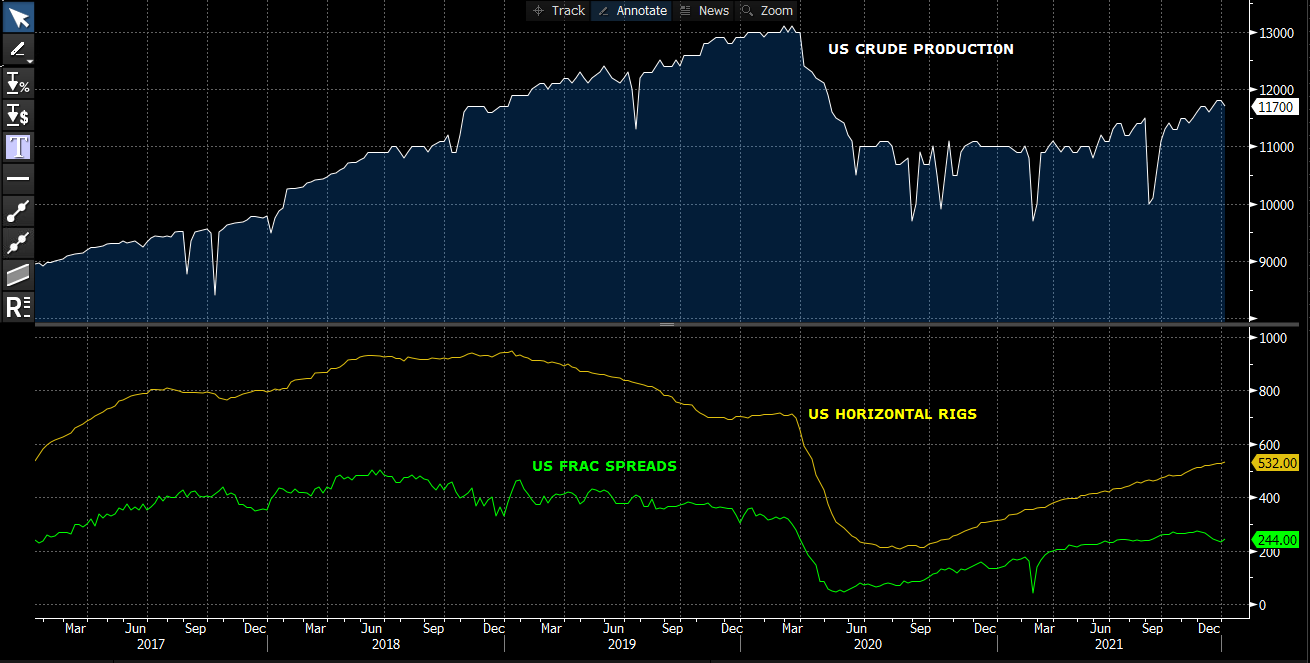
As US activity and production are increasing. In fact, the EIA STEO referenced above notes 2023 will see new ATH for US crude production. We expect US production levels will be approaching pre COVID highs by year end 2022.
To sum it up, the market is pricing in a lot of good news in a short period of time. The narrative, apart from nagging data points like record product inventory builds and positive supply revisions ex OPEC, is broadly unfalsifiable and thus supportive.
What we’re saying is we are, as we sit today, past the best of the news flow. That marks a subtle inflection that will be manifest in data over the coming weeks.
By the time we get to late 1Q22 the market will be:
At the the end of the Fed taper
Staring rate hikes in the eye
Watching sequentially lower PMI releases
Watching US production of all hydrocarbons progress towards new highs
Stuck in seasonally weak energy demand period
Digesting the first of many crude inventory builds
Processing progressively lower inflation prints
VR
viscosityredux@gmail.com